
Debugging Laravel in production can feel overwhelming without the right tools. Traditional methods like dd() or Log::info() often fail to provide the full picture, leaving developers stuck in a frustrating loop of guesswork and redeployment. This article breaks down modern debugging techniques and tools that save time, improve efficiency, and help you understand what’s really happening in your application.
Key Takeaways:
- Logs are limited: Logs tell you what happened but not why or how – especially in complex workflows involving background jobs, APIs, or caching.
- Modern tools to use:
- Laravel Telescope: Tracks requests, exceptions, and queries in real-time.
- TraceKit: Offers distributed tracing, live breakpoints, and request flow visualization.
- Xdebug: Provides detailed, step-by-step code analysis (best for staging environments).
- Efficiency boost: Advanced tools can cut debugging time by 60%–70%, especially for small teams.
- Pricing: Tools like TraceKit are budget-friendly, starting at $29/month for 1M traces, with a free tier for smaller projects.
Why This Matters:
Modern debugging tools go beyond error messages, helping you pinpoint root causes faster. Features like live breakpoints and AI anomaly detection let you troubleshoot issues without redeploying code. Whether you’re dealing with slow queries, API delays, or N+1 problems, these tools provide actionable insights to fix problems efficiently.
Stop wasting time on trial-and-error debugging. Learn how to streamline your production debugging workflow with the right tools and techniques.
5 Laravel Debug Tools That Will Save You Hours! ⏱️💡 – Configuration and key features explained
sbb-itb-0fa91e4
Why Traditional Logging Falls Short in Production
Using local tools like dd() and Log::info() might feel dependable, but they only capture what you explicitly choose to log. In production, this often means missing critical context – like a user ID, request ID, or the real-time state of variables. Without these details, you’re left guessing, trying to piece together what actually happened. This gap between logged events and the full picture highlights the challenges of debugging in production.
The Gap Between Logs and Debugging Requirements
Standard logs focus on isolated events but rarely provide the complete context needed for effective debugging in production. For example, Laravel logs might tell you that an error occurred, a query took too long, or a job failed. But they often leave out the "why" – the deeper details that explain what caused the issue [1]. As TraceKit’s Founder points out, Laravel’s logs may flag an error but fail to provide the surrounding context needed to resolve it.
Performance issues are even harder to detect. Logs might show that a request took 5 seconds, but they won’t tell you that 3.5 of those seconds were spent waiting for an email to send. When your application relies on background jobs, Redis caching, or external services like Stripe or AWS, traditional logs simply don’t capture the intricate, interconnected flow of events [1][5].
Common Problems with Log-Only Debugging
One of the biggest frustrations with log-based debugging is the trial-and-error cycle. You add more logs, redeploy the code, and wait for the issue to happen again – only to discover you logged the wrong variable [5]. This process can drag on for days, especially when dealing with intermittent or condition-specific bugs. Modern Laravel applications, with their complex workflows, make this approach even less efficient.
The rise of AI coding assistants adds another layer of complexity. With 78% of developers now using these tools [5], you’re often debugging code that wasn’t written line-by-line by a human. This makes "guess-and-log" debugging even more of a headache. Developers end up wasting hours digging through log files, adding more logs, and redeploying code, when what’s really needed is a way to see the entire request flow and application state in one place.
Key Tools for Debugging Laravel in Production
When traditional logging falls short, it’s time to turn to tools that provide clear insights into your application’s behavior. Laravel Telescope, TraceKit, and Xdebug each play a vital role in debugging production issues, offering distinct approaches to monitoring and analysis.
Using Laravel Telescope for Monitoring
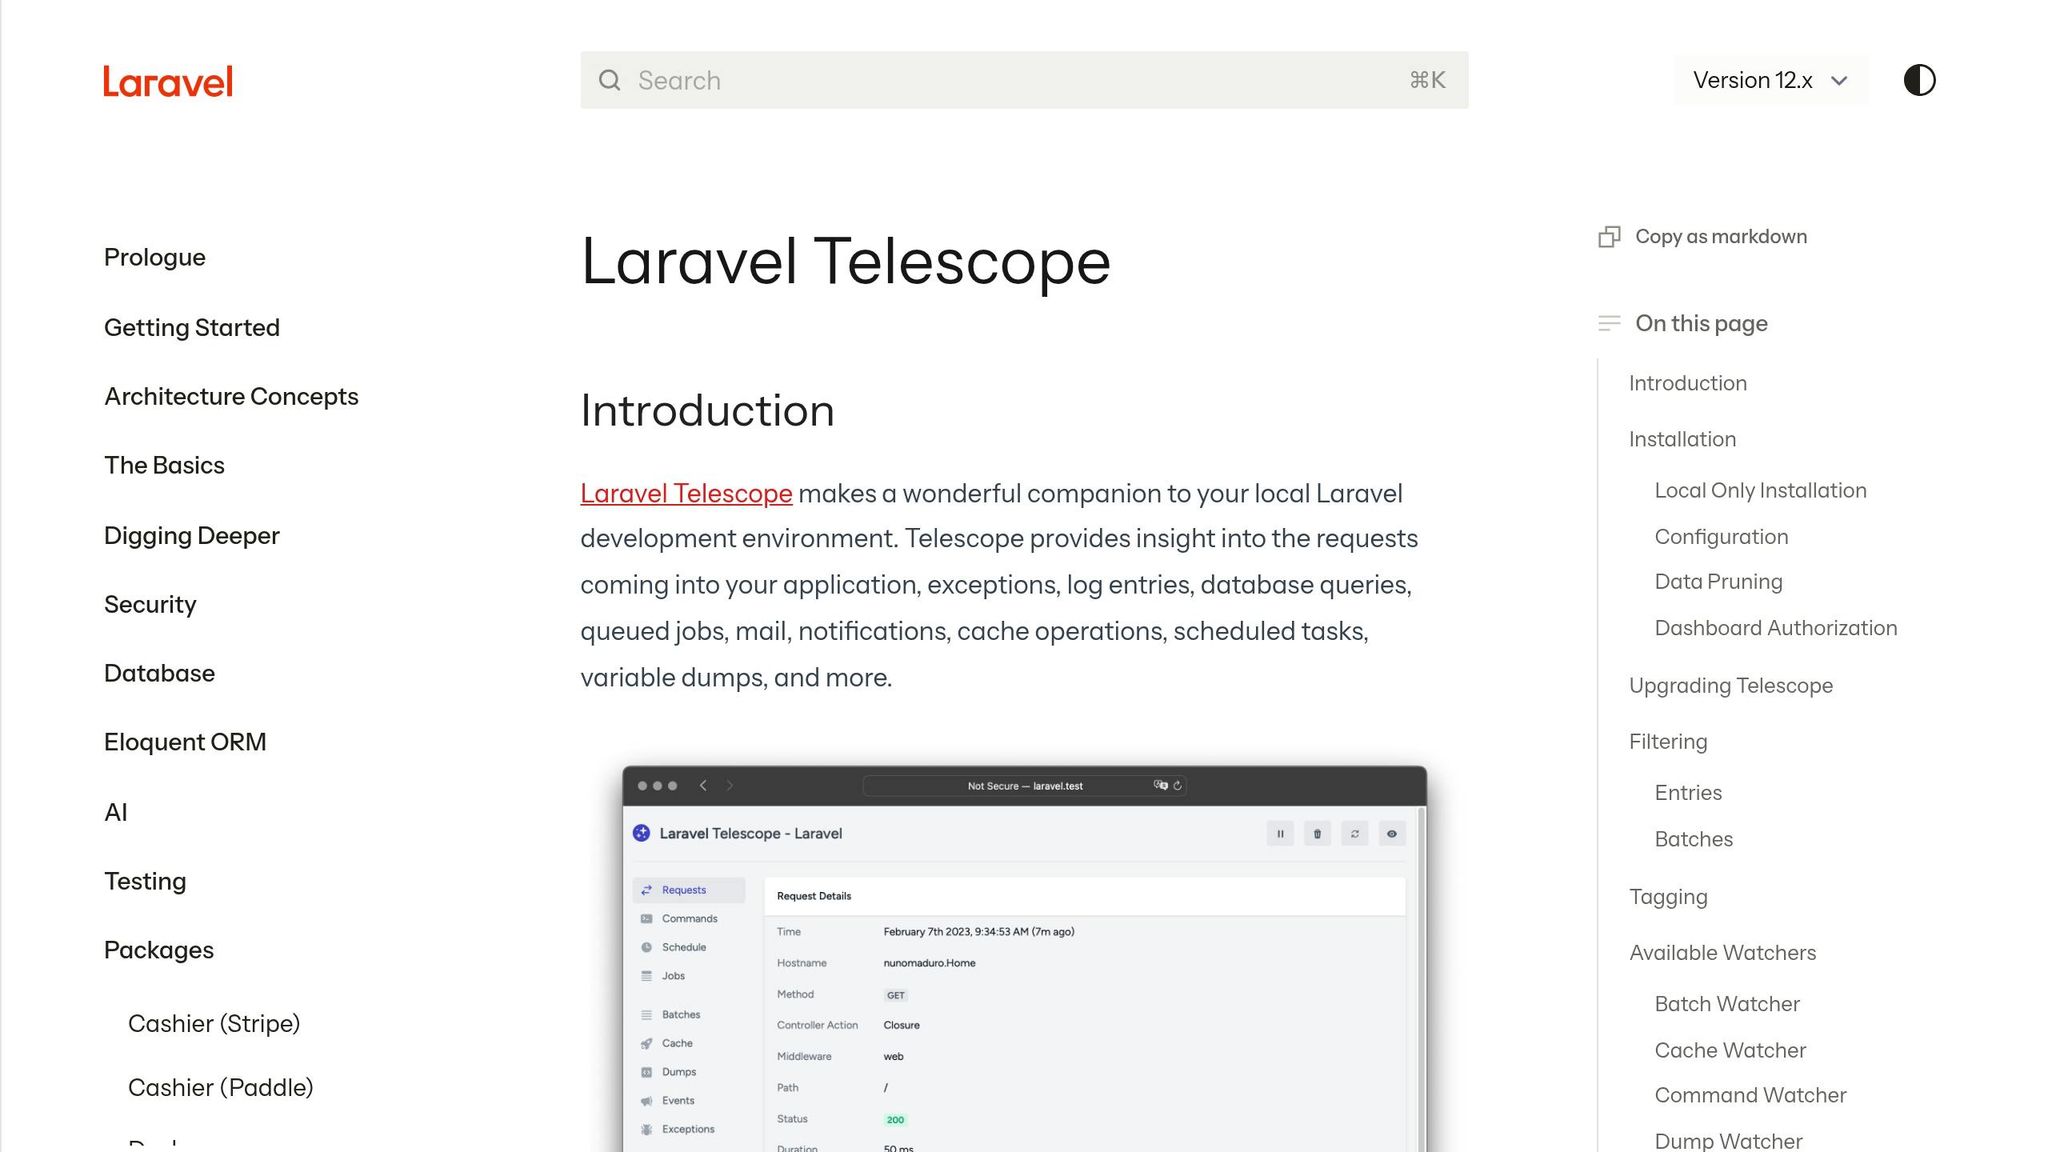
Laravel Telescope serves as an in-app monitoring tool with a real-time dashboard accessible at /telescope. This dashboard provides a detailed view of requests, exceptions, database queries, queued jobs, mail, notifications, cache operations, and scheduled tasks [6]. Essentially, it centralizes all the activity within your Laravel application.
"Laravel Telescope makes a wonderful companion to your local Laravel development environment… [providing] insight into the requests coming into your application, exceptions, log entries, database queries, and more." – Laravel Documentation [6]
What makes Telescope stand out? It’s open-source and free. However, there are a few things to keep in mind for production use:
- Access Control: Use
TelescopeServiceProviderto restrict access to the dashboard by limiting it to specific email addresses or admin roles. - Database Pruning: Telescope can generate a lot of data. Use the
telescope:prunecommand to remove entries older than 24 hours. Scheduling this command daily keeps thetelescope_entriestable manageable [6][7]. - Filtered Monitoring: In production, use the
Telescope::filterclosure to focus on critical entries like failed jobs, slow queries, and exceptions, instead of logging every request [6][4].
While Telescope gives you a detailed view within your Laravel app, TraceKit takes it a step further by mapping out your system’s entire request flow.
Distributed Tracing with TraceKit
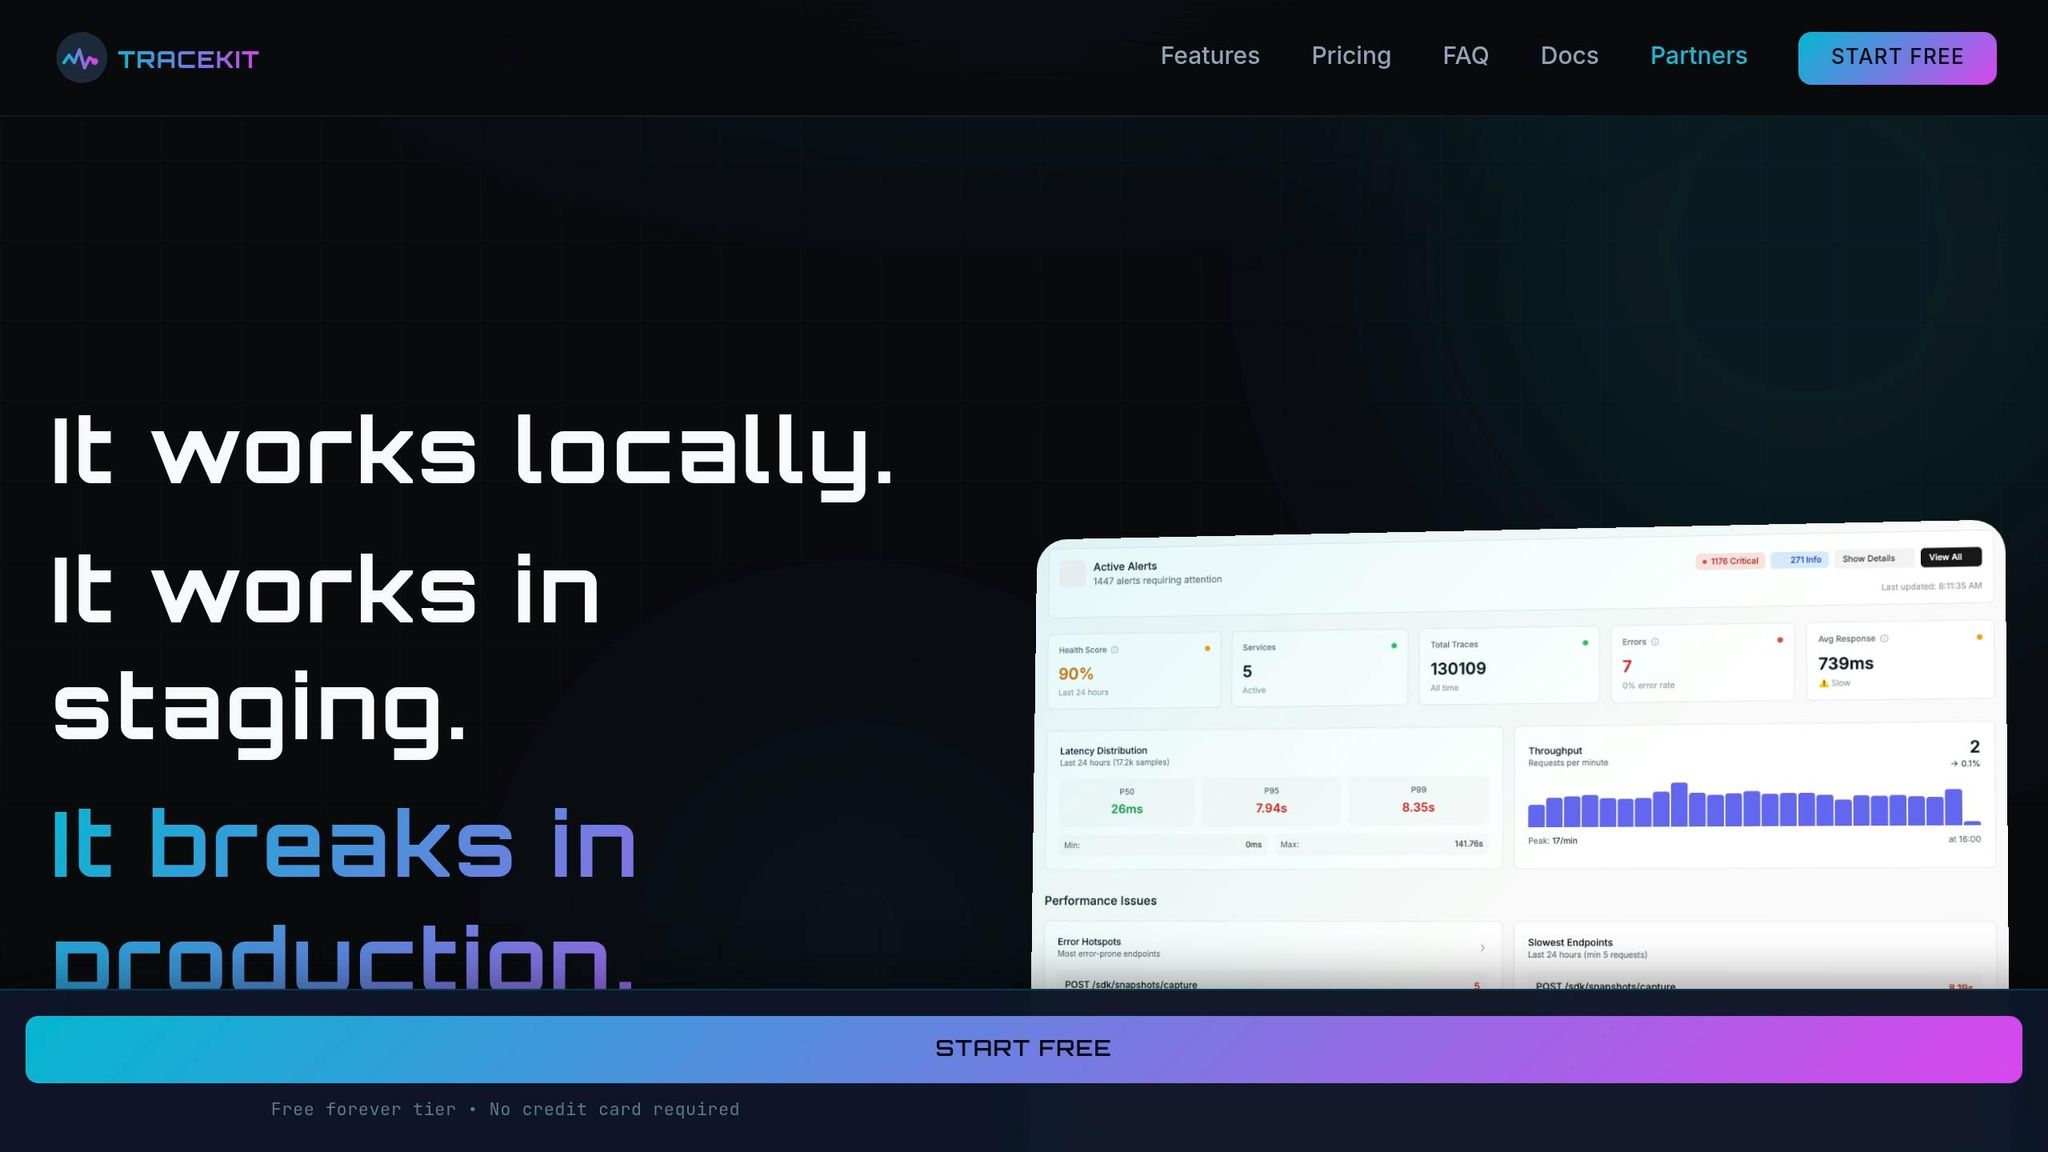
TraceKit offers a broader perspective with distributed tracing, capturing the timeline of HTTP requests, database queries, and external API calls with sub-millisecond accuracy [1]. This is especially helpful for applications that rely on background jobs, caching, or third-party services like Stripe or AWS.
For example, a Laravel e-commerce site in 2025 experienced checkout delays exceeding 5 seconds. By using TraceKit, the team identified the real bottlenecks: an email-sending process taking 3,500ms and excessive tax service API calls (700ms across 50 calls), rather than the Stripe API, which only took 800ms. By queueing emails and caching tax calculations, they reduced response times to 900ms – an 82% improvement [1].
TraceKit also excels at identifying N+1 query issues. It uses flame graphs to visualize inefficient queries as numerous small database spans, making them easy to spot [1]. Additionally, you can add custom spans to critical processes, such as processOrder, to pinpoint delays in multi-step workflows [1]. TraceKit supports Laravel versions 10-12 and can be set up in just a few minutes [1].
Pricing is straightforward: A "Free forever" plan is available, perfect for small teams, while the $29/month Starter plan offers 1 million traces per month with a 7-day retention period, ideal for apps handling roughly 100,000 requests daily.
For detailed, step-by-step code analysis, Xdebug is the go-to tool.
Xdebug for Detailed Code Analysis
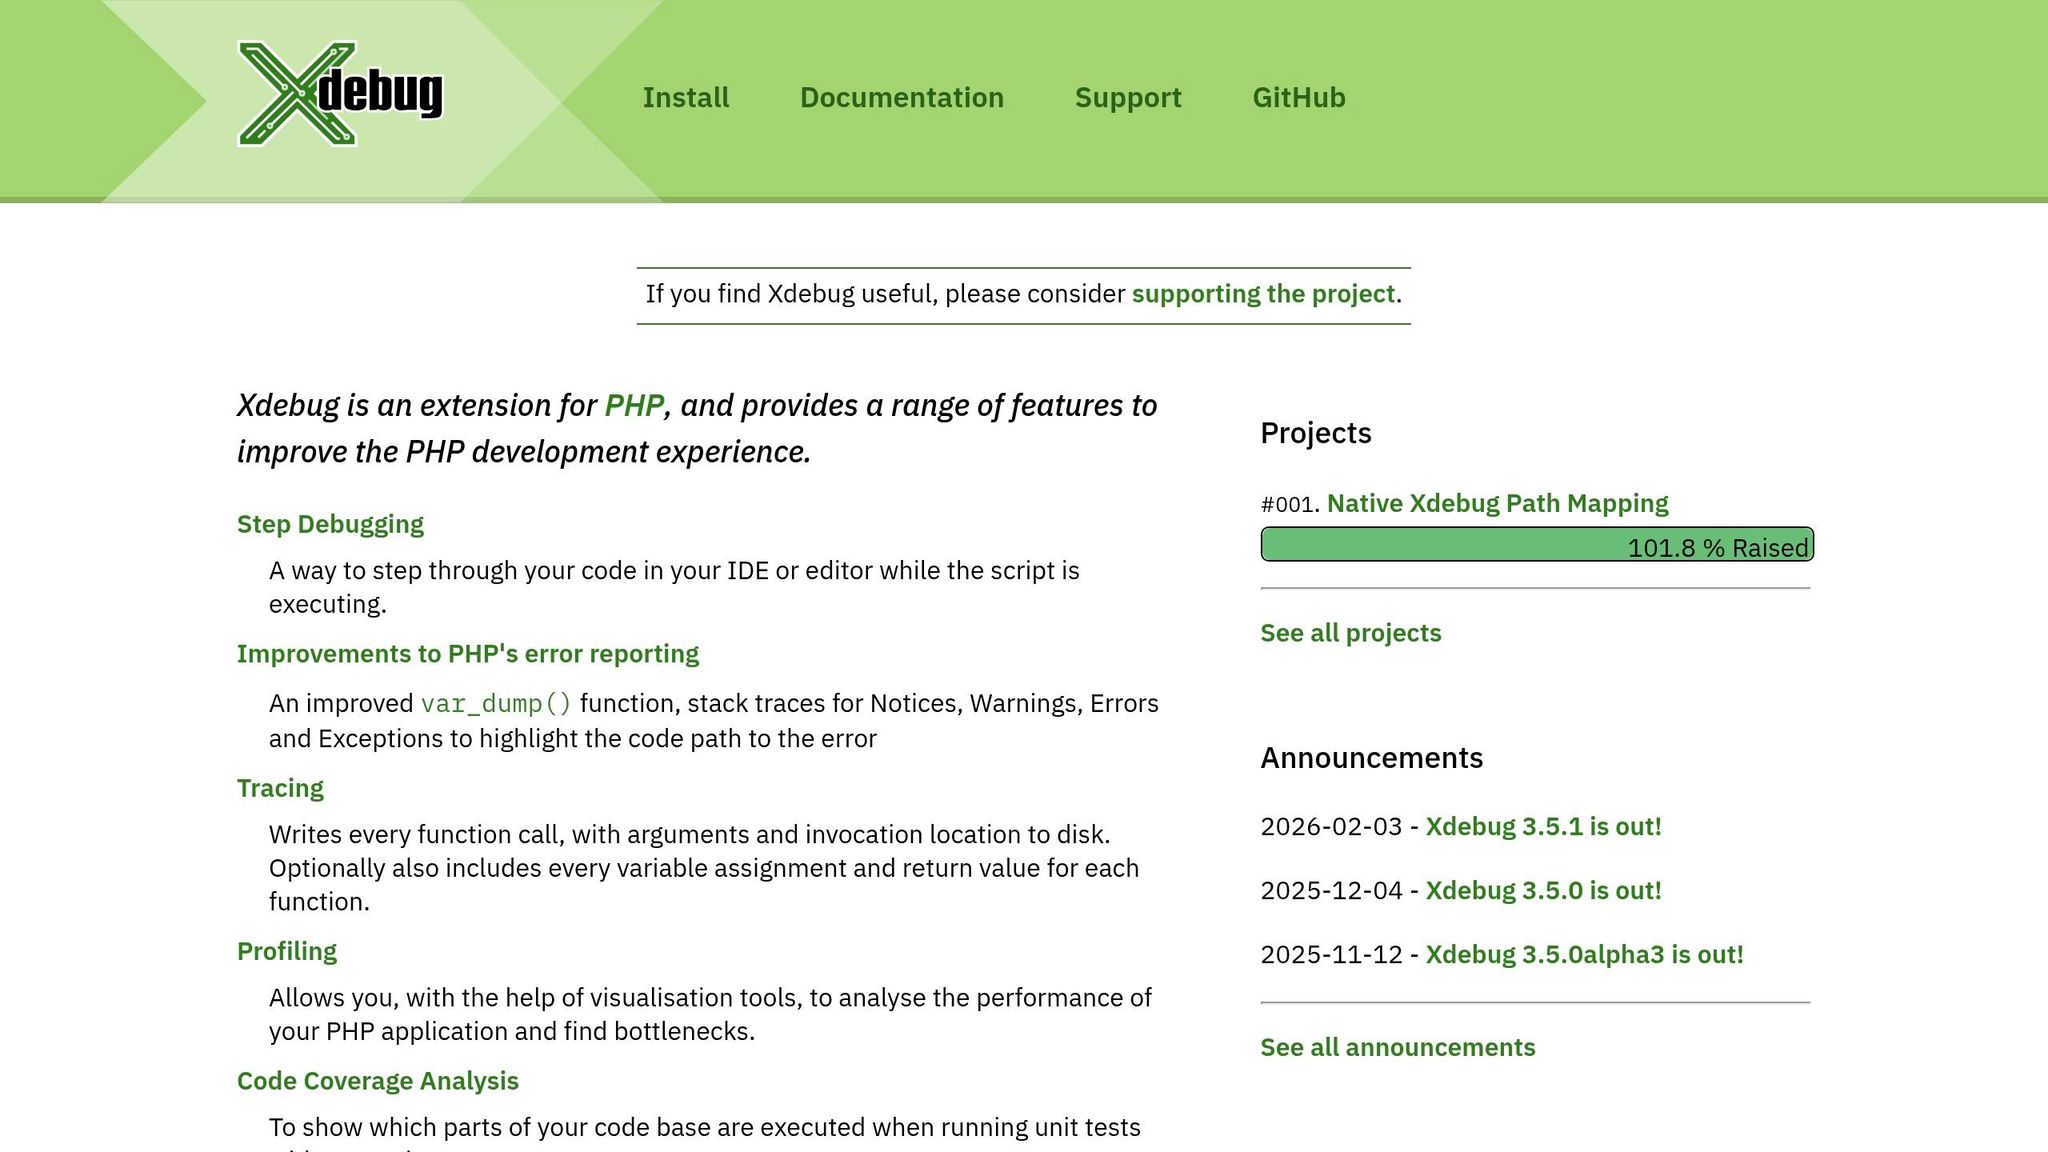
When you need to pause execution and inspect variables line-by-line, Xdebug is the tool for the job. While it’s not suited for live production environments due to its performance impact, it shines in development or staging setups [3].
Xdebug is particularly useful for troubleshooting complex logic errors. For instance, if a calculation is returning unexpected results, it allows you to trace how variables are modified through a chain of method calls. It complements production monitoring tools by offering a microscopic view of your code’s behavior in a controlled environment.
Modern Debugging Techniques for Production Environments
When it comes to production debugging, traditional methods like logging and distributed tracing are no longer the only tools in the developer’s toolkit. Techniques such as live breakpoints, waterfall visualizations, and AI-driven anomaly detection now allow for real-time debugging without the need for redeployment – cutting out the delays of CI/CD pipelines.
Live Breakpoints for Real-Time Code Inspection
Live breakpoints let developers capture variable states, headers, and request payloads without halting execution or disrupting the user experience. This asynchronous approach ensures that debugging happens smoothly, even in live environments [8].
The benefits are immediate and practical. Take Alex, a solo SaaS founder, for example. Using TraceKit, Alex debugged a Stripe webhook issue that was returning a 200 status but failing to activate subscriptions. By setting a capture point at the webhook handler, Alex discovered a race condition caused by an asynchronous database write. What could have taken days to resolve was pinpointed in just 10 minutes [8].
"TraceKit provides production debugging without redeploying… Set live breakpoints, capture variable state, and trace requests across services."
- Terry Osayawe, Founder of TraceKit [9]
The performance impact of live breakpoints is minimal – typically under 5% – and setup is quick, often taking less than 4 minutes [8]. Once real-time insights are gathered, visualizing request flows can take debugging a step further.
Request Waterfall Visualization for Performance Analysis
Waterfall visualizations complement live breakpoints by mapping out the entire request timeline in a clear, visual format. Each operation appears as a block, making it easy to spot performance bottlenecks.
Consider an e-commerce site using Laravel that, in January 2026, faced a slow checkout process taking 5,200ms. A waterfall chart revealed two major issues: email sending was delaying the response by 3,500ms, and tax calculations were making 50 redundant API calls. By queuing emails and caching tax data, the team dramatically improved response times [1].
Waterfall charts also make N+1 query problems glaringly obvious. Instead of a single efficient query, these issues appear as a "staircase" of repetitive database spans. When this pattern emerges, developers can use Laravel’s with() eager loading method to optimize database queries. Additionally, wrapping critical business logic – like payment processing – in custom spans can help identify which step is causing delays [1].
AI-Powered Anomaly Detection
While tools like TraceKit help map request flows, AI-powered anomaly detection takes it further by automatically flagging irregularities. These systems save developers significant time – 30 to 90 minutes on average – by linking traces to anomalies without manual effort [8]. They can even highlight N+1 query issues directly in flame graphs.
This capability is becoming increasingly important. A 2026 survey found that 78% of developers now use AI coding assistants [9]. As more production code is generated by machines rather than written manually, AI-driven observability tools provide essential runtime insights.
"TraceKit fills that gap. It’s the observability layer for AI-generated code. See what’s actually happening at runtime, even when you didn’t personally write every function."
- Terry Osayawe, Founder of TraceKit [9]
These systems don’t just catch coding errors – they also detect security issues, DDoS attacks, and unusual traffic patterns that might go unnoticed with manual monitoring [8]. Configuring alerts for metrics like high error rates (>1%), slow P95 latency (>1,000ms), or large queue backlogs (>5,000 jobs) can help teams address problems before users even notice [1].
TraceKit vs. Sentry: A Comparison for Small Teams
TraceKit vs Sentry Feature and Pricing Comparison for Laravel Teams
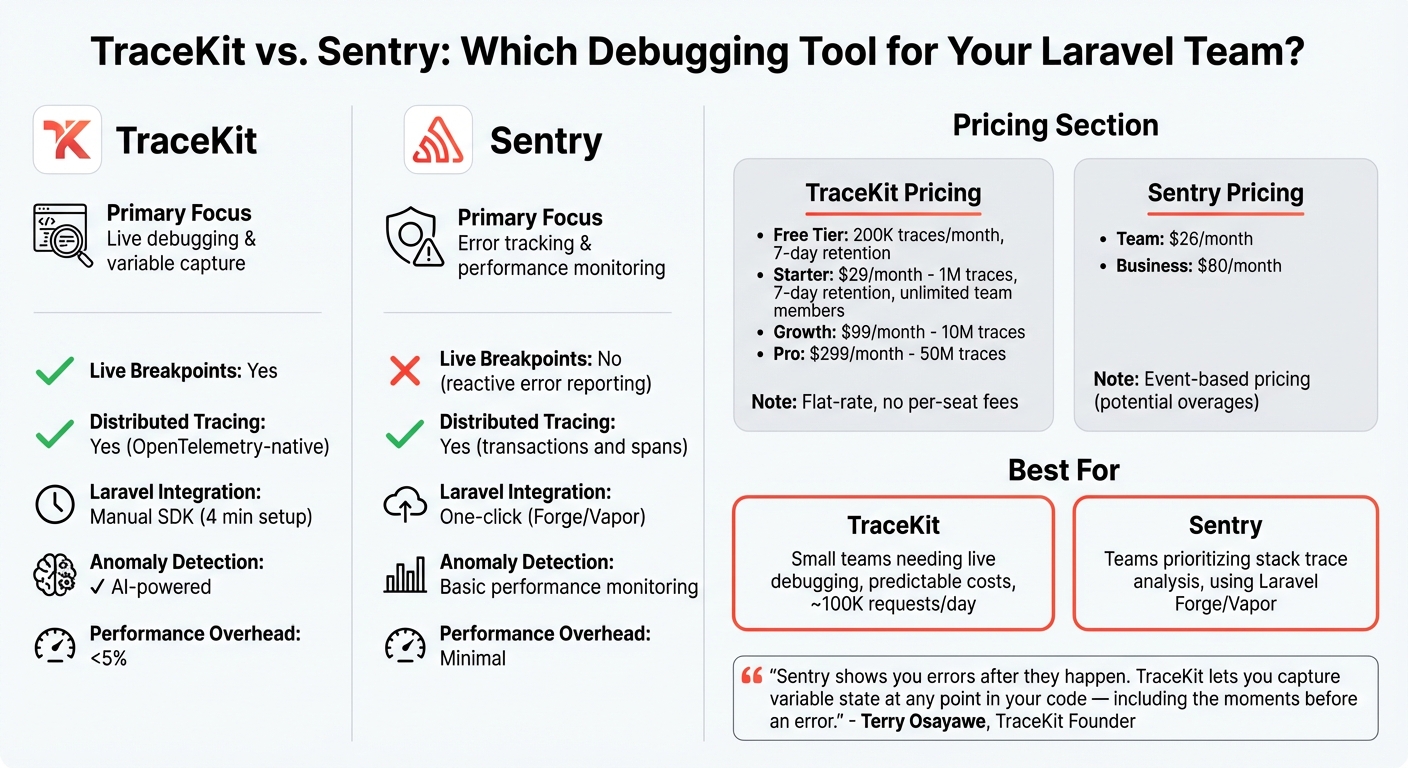
When it comes to debugging tools for small Laravel teams, finding the right balance between features and budget is crucial. Two popular options in this space are Sentry and TraceKit. Sentry has earned a strong reputation among Laravel developers, thanks to its seamless integration with Laravel Forge and Vapor. On the other hand, TraceKit provides a simpler, budget-friendly option that combines error tracking with live debugging. This comparison highlights how these tools align with the needs of small teams focused on real-time debugging and cost-efficient production monitoring.
The main difference lies in their approach to debugging. Sentry specializes in reporting errors after they occur, offering detailed stack traces and contextual information. Meanwhile, TraceKit takes a proactive approach, allowing developers to capture variable states at any point in their code – even moments before an error occurs or for logic bugs that don’t trigger exceptions. As TraceKit’s founder, Terry Osayawe, puts it:
"Sentry shows you errors after they happen. TraceKit lets you capture variable state at any point in your code – including the moments before an error, or for bugs that don’t throw exceptions at all." [8]
Feature Comparison
Both platforms support distributed tracing, but they differ in their primary focus and debugging capabilities. Sentry integrates seamlessly with Laravel Forge and Vapor, enabling one-click activation, while TraceKit requires a manual SDK installation that takes about four minutes.
| Feature | TraceKit | Sentry |
|---|---|---|
| Primary Focus | Live debugging & variable capture | Error tracking & performance monitoring |
| Live Breakpoints | Yes | No (reactive error reporting) |
| Distributed Tracing | Yes (OpenTelemetry-native) | Yes (transactions and spans) |
| Laravel Integration | Manual SDK (tracekit/laravel-apm) |
Integrated with Laravel Forge/Vapor |
| Anomaly Detection | AI-powered anomaly detection | Basic performance monitoring |
| Performance Overhead | Less than 5% [8] | Minimal |
Pricing and Scalability
Cost efficiency is another key factor, especially for small teams. TraceKit offers flat-rate pricing without per-seat fees or overage charges, making costs predictable. In contrast, Sentry’s pricing is event-based, which can lead to unexpected expenses if usage spikes.
- TraceKit Starter: $29/month for 1 million traces, 7-day retention, and unlimited team members.
- TraceKit Growth: $99/month for 10 million traces with 30-day retention.
- TraceKit Pro: $299/month for 50 million traces with 180-day retention.
Sentry’s pricing starts at $26/month for the Team plan, with the Business plan available at $80/month.
"At $29/month, it’s much simpler than Datadog for what we need, without feeling stripped down."
- Adil Ali, Fullstack Developer [8]
For teams managing around 100,000 requests daily, the TraceKit Starter plan is an affordable solution that avoids enterprise-level costs. Additionally, TraceKit’s free tier – offering 200,000 traces with 7-day retention – can be a great option for students or indie developers experimenting with the platform. While Sentry remains a solid choice for in-depth stack trace analysis, small teams might find TraceKit’s straightforward pricing and broader functionality, including general logging and uptime monitoring, a better fit for their needs.
Building a Debugging Workflow for Laravel Applications
Step-by-Step Debugging Process
Successful debugging in Laravel hinges on three key elements: distributed tracing to follow request flow, structured logging with useful context (like user IDs), and metrics with alerts to track request performance and error rates [1]. When an alert pops up – say, P95 latency exceeds 1,000ms or error rates climb above 1% – the first step is to figure out whether the issue affects the entire system or is isolated to a specific area.
Once the scope is clear, use a waterfall view to trace the request and identify bottlenecks. Delays might stem from database queries, external APIs (e.g., Stripe or AWS), or middleware. If flame graphs show numerous small database spans instead of one efficient query, you’re likely dealing with an N+1 query issue. Solve this by using Eloquent’s with() for eager loading. Afterward, dig into structured logs filtered by user_id or request_id to get more context. To reproduce and fix the bug, experiment with the failing code using Laravel Tinker or step through it line by line with Xdebug.
These steps should then be integrated seamlessly into your deployment workflow.
Adding Debugging Tools to CI/CD Pipelines
Incorporating debugging tools into your CI/CD pipeline can help catch issues early and prevent them from escalating. For example, include php artisan migrate --force in your deployment script to keep database schemas in sync for tools like Telescope or TraceKit. If you’re using OpenTelemetry-based tools such as TraceKit, install the PHP OpenTelemetry extension during the build process with pecl install opentelemetry.
To minimize the impact on production, disable debugging tools with TELESCOPE_ENABLED=false and activate them only when troubleshooting. Adjust sampling rates using OTEL_TRACES_SAMPLER_ARG=0.1, so only 10% of requests are traced. This approach reduces performance overhead while still capturing valuable data. Additionally, schedule the php artisan telescope:prune command in app/Console/Kernel.php to automatically clean up old data daily, keeping only the last 24–48 hours to avoid database bloat.
Debugging Best Practices for Small Teams
For smaller teams, simplicity and efficiency are key to effective debugging. Here are some practical tips:
- Add business context to traces: Use
Telescope::tagor custom spans to attach details likeuser_id,order_id, orplan_type. This makes it easier for team members to pinpoint specific failed requests quickly. - Limit dashboard access: Secure your debugging tools by configuring
TelescopeServiceProviderwith Laravel Gates, restricting access to authorized users (e.g.,[email protected]). - Protect sensitive information: In production, set
APP_DEBUG=falseand useTelescope::hideRequestParametersandTelescope::hideRequestHeadersto prevent storing sensitive data like passwords, CSRF tokens, or authorization headers. - Focus on slow queries: Configure watchers to log only queries exceeding 100ms – or 50ms for apps where performance is critical. This reduces unnecessary overhead.
- Wrap external API calls: Add custom spans with timeouts around HTTP calls to quickly identify if third-party services are causing delays.
Studies show that developers using tools like Telescope can reduce debugging time by 60–70% [2]. These practices not only save time but also make the debugging process more manageable for smaller teams.
Conclusion
Traditional logging often traps developers in a frustrating "guess-and-redeploy" loop, wasting valuable time on trial and error. Modern debugging tools break this cycle by introducing features like live breakpoints and distributed tracing. These tools not only pinpoint errors but also uncover the root causes by tracing the entire request flow – covering database queries, external APIs, and queue jobs [1][9].
This shift in debugging is especially impactful for small teams managing complex production issues. With 78% of developers now leveraging AI coding assistants like Cursor or GitHub Copilot [9], the need for runtime visibility has never been greater. Tools like TraceKit meet this demand by combining distributed tracing with AI-driven anomaly detection, offering insights even when developers aren’t familiar with every line of code [9].
The benefits of these modern techniques are clear, especially when it comes to cost and performance. For small teams, affordability is critical. While enterprise tools like Datadog can exceed $500 per month, TraceKit delivers similar capabilities for just $29/month for 1,000,000 traces – enough to handle about 100,000 requests daily. For students and early-stage projects, the free tier provides 200,000 traces per month [9]. Real-world examples further highlight its value: one e-commerce site used TraceKit to cut checkout times from 5.2 seconds to just 900ms – an 82% reduction – by identifying bottlenecks like blocking email sends and redundant tax API calls [1].
Stop relying on guesswork – try TraceKit’s free tier for real-time, actionable debugging.
FAQs
How do I debug production issues without redeploying?
To troubleshoot production issues in Laravel without the need to redeploy, you can rely on tools like live breakpoints, distributed tracing, and observability platforms. These methods allow you to monitor your application in real-time, follow requests as they move through different components, and review logs, metrics, and traces remotely. Tools such as TraceKit and Laravel Telescope are particularly helpful for live debugging, enabling you to diagnose problems efficiently while keeping your application running smoothly and avoiding unnecessary downtime.
How can I find what’s slowing a request in production?
To figure out what’s causing delays in a request during production, you can use distributed tracing. This method follows requests as they move through your Laravel app, covering everything from database queries to API calls. It gives you a detailed timeline, making it easier to spot where the bottlenecks are happening. On top of that, live breakpoints let you check the state of variables in real time without halting the application. By using these tools together, you can get a better understanding of performance issues while your app is live.
How do I keep production debugging safe and private?
When debugging in a production environment, it’s crucial to prioritize security and privacy. Here are some key practices to keep in mind:
- Disable Laravel’s Debug Mode: Always turn off debug mode in production. Leaving it on can expose sensitive details, such as error messages and environment variables, which could be exploited.
- Avoid Debugging Tools in Production: Tools like Debugbar are helpful during development but can leak information if used in a live environment. Keep these strictly for local or staging setups.
- Environment-Specific Configurations: Separate your production credentials from development ones by using environment-specific settings. This ensures sensitive production data is not inadvertently exposed.
- Monitor Debug Settings: Regularly check for active debug modes in your production environment. Automated alerts can help catch any accidental misconfigurations.
- Secure Logs and Access: Protect your application logs by restricting access to authorized personnel only. Logs can contain detailed information that might aid an attacker.
- Verify Settings During Deployment: As part of your deployment process, double-check all configurations to ensure they align with your production security standards.
By following these practices, you can debug effectively while keeping your production environment secure and private.