
Debugging production-level Gin applications can feel overwhelming, especially with Go’s concurrency model and high traffic demands. This guide simplifies the process with actionable steps to improve observability, trace errors, and enhance performance in your Gin services. Here’s what you’ll learn:
- Distributed Tracing: Use OpenTelemetry and
otelginto track requests across handlers, databases, and external APIs. - Context Handling: Ensure trace continuity in goroutines by passing
c.Request.Context()explicitly. - Performance Profiling: Add
pproffor CPU and memory profiling to identify bottlenecks and leaks. - Database Optimization: Trace GORM queries with
otelgormand tune connection pool settings for efficiency. - Error Logging: Implement structured logging with tools like zap or logrus for better visibility into issues.
- Observability Tools: Compare manual OpenTelemetry setups with automated solutions like TraceKit for simplicity and cost-effectiveness.
Setting Up Distributed Tracing with OpenTelemetry
Distributed tracing helps you track a single request as it moves through your Gin application, interacting with databases and external services along the way. It provides a complete picture of the request’s journey, from Gin handlers to database queries.
The otelgin package simplifies much of the setup. By adding router.Use(otelgin.Middleware("service-name")) to your Gin router, you can automatically capture key HTTP request details like method, route, status code, and timing. Important: This middleware must always be the first in your chain. If you place it after middleware that calls c.Abort() (e.g., authentication or health checks), those requests won’t generate spans.
"The rule is straightforward: otelgin.Middleware should always be the first middleware in your chain." – Nawaz Dhandala, Author [5]
Save money by filtering out unnecessary traces. High-traffic endpoints like /health or /metrics can generate a flood of traces that offer little value. Use otelgin.WithFilter to exclude these from tracing, reducing both storage and processing costs. Additionally, you can use WithSpanNameFormatter to create more meaningful span names in your dashboard, such as "GET /users/:id" instead of generic HTTP method labels.
Adding Tracing Middleware to Gin
To get started, install the necessary packages:
go get go.opentelemetry.io/contrib/instrumentation/github.com/gin-gonic/gin/otelgin go get go.opentelemetry.io/otel Initialize your tracer provider at the very beginning of main() – before configuring your Gin router – to ensure all components are properly instrumented.
Here’s a basic example:
router := gin.Default() router.Use(otelgin.Middleware("my-gin-service")) This middleware automatically captures key attributes like HTTP method, route, status code, URL, and user agent. For production environments, always use a batch span processor (sdktrace.WithBatcher(exporter)) instead of a simple processor to minimize network overhead. While the middleware’s performance impact is typically under 1ms per request, batching further reduces the load.
| Middleware Option | Purpose |
|---|---|
WithFilter |
Exclude specific paths from tracing (returns bool) |
WithTracerProvider |
Use a custom TracerProvider instead of the default global one |
WithSpanNameFormatter |
Customize how spans are labeled in your backend |
WithPropagators |
Control how trace context is extracted from headers |
Once the middleware is in place, ensure proper context handling for goroutines.
Passing Context Between Goroutines
Context propagation is critical in concurrent code. When you spawn a goroutine inside a Gin handler, it doesn’t automatically inherit the parent’s trace information. To maintain trace continuity, extract the Go context from gin.Context using c.Request.Context() and pass it explicitly to your functions or goroutines.
Avoid using context.Background() or context.TODO() in a request handler, as these create new, unconnected traces. Instead, extract the context once and pass it along:
ctx := c.Request.Context() go func(ctx context.Context) { // Maintain trace continuity span := trace.SpanFromContext(ctx) // Perform background work here }(ctx) "When you launch a goroutine, you create an independent execution context that doesn’t automatically inherit the parent’s trace information. Without proper context propagation, traces fragment into disconnected pieces." – Nawaz Dhandala, Author [9]
For worker pools using channels, wrap your data and context in a struct like this:
type WorkItem struct { Ctx context.Context Data string } This ensures the trace stays linked as the work item moves through the channel. For "fire and forget" operations that need to outlive the request but remain part of the same trace, use trace.ContextWithSpan(context.Background(), trace.SpanFromContext(parentCtx)). This detaches the operation from the parent’s cancellation signal while preserving trace continuity [9].
Connecting to Jaeger and Other Backends
To send traces to Jaeger or any OTLP-compatible backend, configure an exporter in your tracer provider setup. The OTLP exporter (otlptracegrpc or otlptracehttp) defaults to connecting to localhost:4317 for gRPC. Your TracerProvider will need three key components: an exporter, a resource (to define your service name), and a batch span processor.
Don’t forget to implement graceful shutdown. Always call tp.Shutdown(ctx) when your application exits to flush any remaining spans to the backend. Skipping this step can result in lost traces that were still buffered when the app stopped. For database instrumentation, use the otelgorm plugin with GORM and ensure queries use db.WithContext(ctx) to link SQL spans as children of the HTTP request span [2][7].
OpenTelemetry relies on W3C Trace Context headers to propagate trace IDs across microservice boundaries. Configuring an exporter ensures seamless trace visibility across your architecture. If you’re working with multiple services, each should have its own tracer provider configured to send data to the same backend. This way, you’ll get a unified view of a request’s journey through your entire system.
Once your traces are set up, you’re ready to dive into performance profiling for deeper insights.
sbb-itb-0fa91e4
Performance Profiling and Optimization
Once tracing is in place, the next step is profiling. This helps you measure actual CPU and memory usage, giving you a clearer picture of how your application behaves under the hood.
Profiling with pprof
The gin-contrib/pprof package makes it easy to add profiling endpoints directly to your Gin router. To get started, install the package with go get github.com/gin-contrib/pprof and register it as middleware. Be cautious when using pprof in production environments. Always serve it on an internal port (like :6060) or secure it with authentication middleware to avoid exposing sensitive information.
import "github.com/gin-contrib/pprof" router := gin.Default() pprof.Register(router) // Adds /debug/pprof/* endpoints To capture a CPU profile, run go tool pprof http://localhost:8080/debug/pprof/profile in your terminal. This command collects a 30-second CPU sample. For memory profiling, use /debug/pprof/heap. If you want to visualize this data, you can generate flame graphs by running go tool pprof -http=:8080 [profile_file]. The graph highlights areas consuming the most CPU or memory, making it easier to pinpoint bottlenecks.
"pprof tells you the truth about your program’s behavior at runtime, not what you think is happening based on reading the code." – Keval Sabhani, Software Engineer [14]
For example, early pprof analysis might reveal inefficiencies such as excessive time spent on JSON encoding. Addressing these issues can lead to noticeable performance improvements, such as increased requests per second [10].
| Profile Endpoint | Data Collected | Use Case |
|---|---|---|
/debug/pprof/profile |
CPU usage over 30 seconds | Identifying slow functions or logic [11][13] |
/debug/pprof/heap |
Memory allocation samples | Detecting memory leaks or high usage [11][14] |
/debug/pprof/goroutine |
Stack traces of all goroutines | Spotting goroutine leaks [11][14] |
/debug/pprof/block |
Goroutines blocked on sync calls | Debugging latency and concurrency issues [11][12] |
/debug/pprof/mutex |
Mutex contention | Identifying lock bottlenecks [12][14] |
For deeper insights, enable mutex and block profiling with runtime.SetMutexProfileFraction(100) and runtime.SetBlockProfileRate. These tools help uncover lock contention and latency. To find memory leaks, compare two heap snapshots taken minutes apart using go tool pprof -base heap1.prof heap2.prof. This highlights memory growth over time [14].
With CPU and memory profiles sorted, the next focus should be database performance.
Tracking Database Queries with GORM
Database efficiency is crucial for smooth production operations. The otelgorm plugin is a powerful tool for creating spans that track database queries. Use db.WithContext() to pass the Gin request context (c.Request.Context()) into GORM operations, allowing you to trace SQL queries and identify inefficiencies like N+1 problems [1][2].
If you notice multiple child spans for a single request, you might have an N+1 query issue. Use GORM’s Preload or Joins to group related queries into a single call. For better performance, set SkipDefaultTransaction to true to avoid wrapping simple reads or writes in unnecessary transactions. Additionally, enabling PrepareStmt caches SQL statements, speeding up repeated queries [2].
To handle high traffic, fine-tune your database connection pool settings:
- SetMaxOpenConns: Limits the number of open connections (e.g., 100 for production).
- SetMaxIdleConns: Keeps a small pool of idle connections (10-20 is typical).
- SetConnMaxLifetime: Prevents stale connections by setting a lifetime limit.
Once database queries are optimized, shift your attention to managing concurrency effectively.
Finding Goroutine Leaks and Race Conditions
Handling concurrent workloads requires careful goroutine management. Monitor active goroutines using runtime.NumGoroutine or pprof’s goroutine profile, which provides stack traces of all running routines. A steadily increasing count could signal leaks caused by routines that never terminate [12].
"If total span time far exceeds the sum of child span times, something is blocking the goroutine between operations." – Ivan Cernja, Encore Cloud [15]
To identify issues like lock contention, use the mutex profile (runtime.SetMutexProfileFraction) and the block profile (runtime.SetBlockProfileRate). For example, if a read-heavy handler shows high contention on a sync.Mutex, switching to sync.RWMutex can allow multiple readers to proceed concurrently [15].
Always use context.WithCancel or context.WithTimeout when launching goroutines. This ensures they terminate properly if the client disconnects. For managing multiple sub-goroutines, the golang.org/x/sync/errgroup package is a great choice. It simplifies error handling and ensures cancellation cascades through all routines, reducing the risk of leaks [15][16].
Error Handling and Observability Practices
Once you’ve tackled profiling and concurrency, the next step is to focus on capturing, logging, and tracing errors. By implementing structured logging and centralized error handling, you can transform debugging in production from a guessing game into a more systematic and efficient process.
Structured Logging with zap or logrus
Structured logging adds machine-readable metadata to your logs, making it easier to search and filter entries in log management tools. One key practice is generating a unique Request ID (UUID), which is included in both response headers and log entries. This allows you to track a single request as it moves across microservices and correlate related logs seamlessly [8][17].
Here’s a practical tip: dynamically assign log levels based on HTTP status codes. For example:
- Use Error for 500+ status codes.
- Use Warn for 400+ status codes.
- Use Info for successful responses.
Additionally, capture Gin’s c.Errors slice at the end of each request to consolidate all errors into a single, context-rich log entry. For panic recovery, structured logs can capture stack traces and request details without crashing the application [8].
| Log Attribute | Description | Benefit |
|---|---|---|
request_id |
Unique UUID for the request | Tracks a request end-to-end [8] |
latency |
Time taken to handle the request | Identifies performance bottlenecks [8] |
status |
HTTP response status code | Helps filter logs by severity [8] |
errors |
Consolidated c.Errors |
Provides a full view of request failures [8] |
stack |
Stack trace on panic | Critical for debugging internal errors [8] |
For high-concurrency applications, consider offloading logging tasks to a separate goroutine. This ensures that logging doesn’t add latency to your requests [18].
Using TraceKit for Production Debugging
TraceKit simplifies production debugging by building on structured logging practices. It introduces live breakpoints, which allow you to capture snapshots of variables and stack traces in real-time – without pausing or redeploying your application [1].
With TraceKit, you can replace over 80 lines of OpenTelemetry boilerplate with just three lines of code [1]. A single middleware (sdk.GinMiddleware()) automatically traces all routes, capturing HTTP methods, status codes, and request flows [1].
The live breakpoints feature is particularly powerful. You can use sdk.CheckAndCaptureWithContext in complex business logic or error blocks to gain instant visibility into variable states during production failures [1].
"Go observability transforms production debugging from days of guesswork to minutes of certainty." – Terry Osayawe, Founder of TraceKit [1]
TraceKit offers a free tier for smaller projects, with paid plans starting at $29/month for 1 million traces. It also provides one-line integrations for tools like GORM, Redis, MongoDB, and gRPC, ensuring context propagation across your stack [1].
Error Propagation Through Middleware
Structured logging is only part of the equation – proper error propagation ensures every error is traceable and tied to its originating request. Start by registering OpenTelemetry middleware (otelgin) at the beginning of your middleware chain. This ensures every request generates a trace span [5]. Use c.Error(err) in Gin to attach errors, which centralized logging can process after c.Next() [8][19].
To maintain consistency across your API, create a custom AppError struct that includes:
- An HTTP status code.
- A machine-readable error code.
- A human-readable message [8].
When an error occurs, use span.RecordError(err) and span.SetStatus(codes.Error, message) to make the issue visible in observability tools like Jaeger or TraceKit [4][5].
Avoid using context.Background() or context.TODO() inside request handlers. These can create orphaned spans, breaking the trace chain. Instead, pass c.Request.Context() to downstream layers (e.g., GORM or Redis) to ensure database queries and external calls are linked to the parent HTTP trace [1][2]. If you enrich the context with values like UserID in middleware, update the request using c.Request = c.Request.WithContext(ctx) so downstream handlers can access the updated context [3].
Finally, use otelgin.WithFilter to exclude high-traffic, low-value requests (like /health or /metrics) from tracing. This reduces noise and overhead in your observability data [4][5].
Comparing Observability Tools for Gin
Comparison of Observability Tools for Gin Applications: Manual OpenTelemetry vs TraceKit SDK
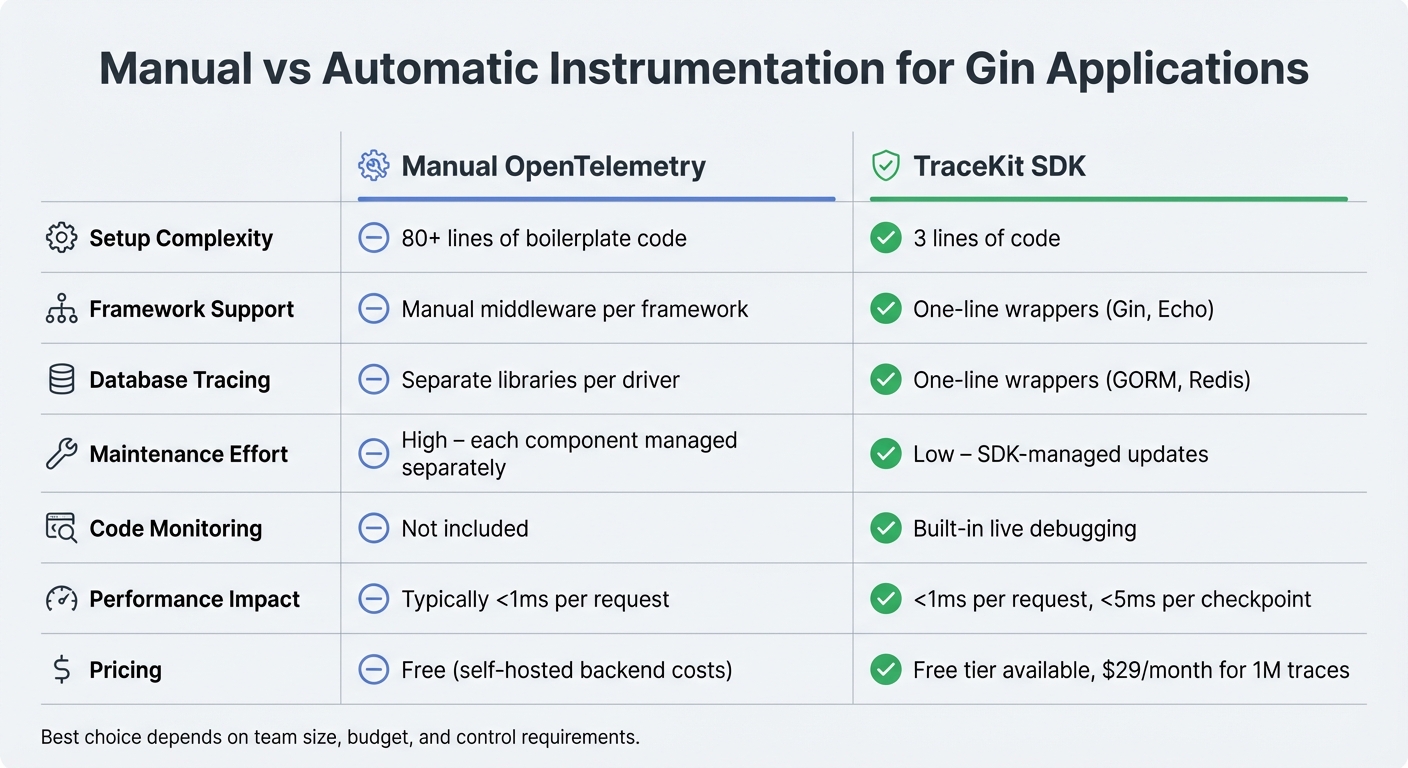
Manual vs Automatic Instrumentation
When setting up observability for Gin applications, you have two main options: manual OpenTelemetry instrumentation or an automatic SDK-based solution. Manual instrumentation gives you full control but comes with a hefty trade-off – lots of boilerplate code. You’ll need to manually initialize tracer providers, exporters, and span processors. On top of that, you must configure middleware for every framework (like Gin or Echo) and each database driver (such as GORM or Redis). This adds significant maintenance effort over time.
On the other hand, TraceKit’s automatic instrumentation makes the process much simpler. Its SDK cuts the setup down to just three lines of code. For example, you can use sdk.GinMiddleware() for routes or sdk.TraceGormDB(db) for databases. This approach has a performance overhead of less than 1 millisecond per request. While it may sacrifice a bit of granularity, it’s a game-changer for small teams looking to save time and reduce complexity.
| Aspect | Manual OpenTelemetry | TraceKit SDK |
|---|---|---|
| Setup Complexity | 80+ lines of boilerplate | 3 lines of code |
| Framework Support | Manual middleware per framework | One-line wrappers (e.g., Gin, Echo) |
| Database Tracing | Separate libraries per driver | One-line wrappers (e.g., GORM, Redis) |
| Maintenance | High – each component managed separately | Low – SDK-managed updates |
| Code Monitoring | Not included | Built-in live debugging |
Next, let’s see how TraceKit stacks up against other tools for small teams.
TraceKit vs Datadog for Small Teams
For small teams, choosing an observability tool often boils down to cost and simplicity. Datadog requires manual configuration and plenty of boilerplate, which can be a hassle for teams with limited resources. In contrast, TraceKit makes observability straightforward – just initialize the SDK in your main() function and add the Gin middleware to automatically trace all your routes.
One standout feature of TraceKit is its live debugging. This lets you set non-breaking breakpoints in production to capture variable snapshots and stack traces in real time, all with less than 5 milliseconds of overhead per checkpoint. Pricing is also straightforward: TraceKit uses a request-based model starting at $29 per month for 1 million traces (roughly 100,000 requests per day). There’s also a free tier, and all plans include unlimited team members and services.
Sentry vs TraceKit for Production Debugging
When it comes to debugging in production, understanding how tools handle live data is key. Sentry is widely recognized for its error tracking and crash reporting capabilities. If your focus is strictly on errors, Sentry might be enough. But if you need to go deeper – like tracing requests across microservices or inspecting variable states during an incident – TraceKit offers more.
TraceKit’s live breakpoints are a standout feature. You can enable or disable debugging points directly through the UI, without redeploying code. These breakpoints capture detailed snapshots, including variable values and stack traces, making it easier to pinpoint issues in real time.
"Go observability transforms production debugging from days of guesswork to minutes of certainty." – Terry Osayawe, Founder of TraceKit
With a performance impact of less than 1 millisecond per request, TraceKit’s SDK is designed for production environments, even under heavy load. Both Sentry and TraceKit offer free tiers, but TraceKit’s trace-based pricing can be more predictable for teams managing distributed Gin applications. For those needing both error tracking and detailed request tracing, you could combine Sentry for error aggregation with TraceKit for distributed tracing. However, this dual-tool approach could add complexity to your observability stack.
Conclusion
Debugging in production doesn’t have to be a headache. By passing c.Request.Context() through your service layers, you can avoid orphaned spans and maintain consistency. Instrumenting both HTTP and database layers helps you pinpoint whether delays stem from business logic or database queries [2][3]. Don’t forget to register your tracing middleware first [5]. To keep things efficient, use filters to exclude high-traffic endpoints like /health or /metrics, cutting down on noise and saving on storage costs [4][6]. These steps lay the groundwork for better observability.
Modern tools make this even easier. Take TraceKit, for example – it trims setup down to just three lines of code with minimal performance impact [1]. And if you need deeper insights, live breakpoints allow you to capture variable states directly in production, all without redeploying. Plus, they add less than 5ms of overhead per checkpoint [1].
For a more comprehensive approach, consider a unified observability stack. Combining distributed tracing, pprof profiling, and database monitoring gives you a full picture of your production environment. This setup can help you catch goroutine leaks, eliminate redundant queries, and trace requests across microservices – all while keeping your app running. Even for smaller teams, this solution is accessible, with pricing starting at $29 per month for 1 million traces.
Finally, don’t overlook graceful shutdowns. Always call tp.Shutdown(ctx) to ensure all spans are exported before your application exits [4]. With these tools and strategies in place, you can debug production issues 10x faster.
FAQs
How do I trace requests end-to-end in Gin?
To monitor requests end-to-end in Gin, you can integrate distributed tracing with OpenTelemetry using the otelgin middleware. Start by importing otelgin and registering it with your Gin router using:
r.Use(otelgin.Middleware("your-service-name")) Once integrated, you can extract the Go context from gin.Context to propagate spans across different calls. This approach gives you detailed insights into the entire request lifecycle, covering middleware, handlers, and even database queries.
How do I keep traces linked across goroutines?
To keep trace continuity intact across goroutines in Go, you need to explicitly pass the trace context. Start by extracting the current context from the parent goroutine, then share it with new goroutines using tools like context.WithValue(). OpenTelemetry simplifies this process by offering utilities to capture and inject trace contexts, making distributed tracing and debugging in concurrent programs much easier. This method is key for connecting traces in applications that rely on multiple goroutines.
How can I safely use pprof in production?
To incorporate pprof safely into your production Gin app, use the gin-contrib/pprof package. This package integrates profiling handlers with minimal impact on performance. However, it’s crucial to enable pprof only in controlled settings, such as staging environments or specific production scenarios where it’s absolutely necessary.
For added security, implement measures like authentication or IP whitelisting to restrict access. Additionally, keep an eye on performance metrics to confirm that the profiling overhead remains insignificant.