Debug Django Apps in Production Without Redeploying
Debug Django apps in production without DEBUG=True or redeploying. Use dynamic logs, flame graphs, and distributed tracing to fix issues in real time.

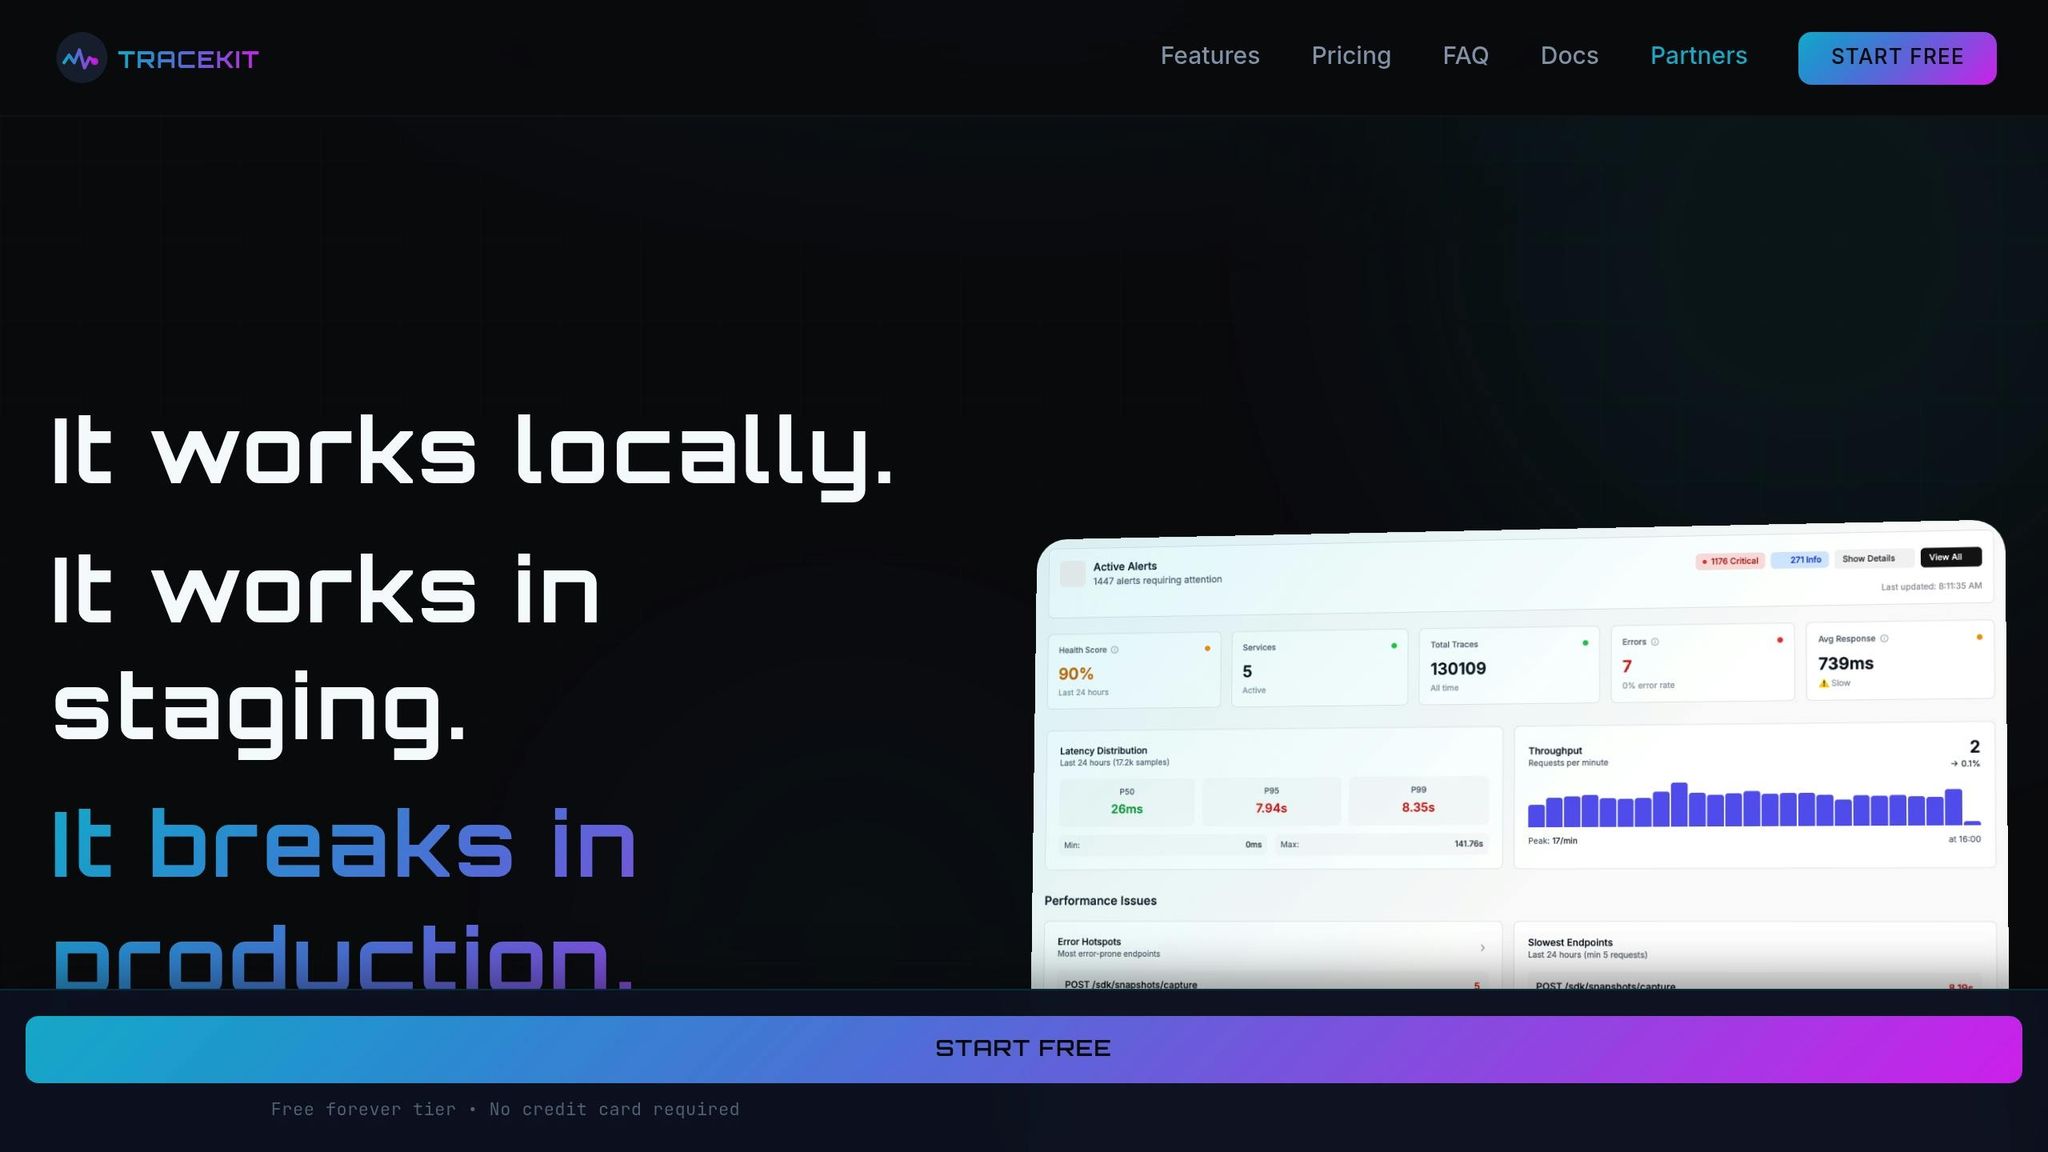
Debugging Django apps in production is tough. You can't rely on DEBUG = True - it’s unsafe and can overwhelm your system. Traditional tools like the Django Debug Toolbar or print statements aren't practical for live environments, leaving developers with limited visibility into production issues. This is where TraceKit steps in.
Key Features:
- Dynamic Logs: Inspect variables and trace code execution without stopping your app.
- Performance Tracing: Analyze bottlenecks with flame graphs and distributed tracing.
- Real-Time Alerts: Get notified of anomalies like DDoS attacks or traffic spikes.
Why TraceKit?
- Quick Setup: Takes under 5 minutes to integrate.
- Low Cost: Starts at $29/month, ideal for small teams.
- Minimal Overhead: Less than 5% performance impact.
With TraceKit, you can debug faster, skip redeployments, and gain real-time insights into your Django app's behavior.
DjangoCon US 2025 - ow to Enjoy Debugging in Production with Karen Tracey

Getting Started with TraceKit for Django
TraceKit makes debugging live Django apps easier by letting you inspect variables and trace code execution in real time. Say goodbye to print statements, unnecessary Git commits, and waiting for CI/CD pipelines to finish.
You can set it up in under 4 minutes with Python 3.8+ and enjoy its minimal performance impact - less than 5%.
Installation and Setup
To get started, install the TraceKit SDK with Django-specific dependencies using pip:
pip install tracekit-apm[django]
Next, update your Django project's settings.py file by adding the TraceKit middleware to the MIDDLEWARE list:
MIDDLEWARE = [ 'tracekit.middleware.django.TracekitDjangoMiddleware', # ... other middleware ]
Then, initialize the SDK in the ready() method of your app's apps.py file:
from django.apps import AppConfig import tracekit import os class MyAppConfig(AppConfig): name = 'myapp' def ready(self): tracekit.init( api_key=os.environ.get('TRACEKIT_API_KEY'), service_name='my-django-app', enable_code_monitoring=True )
For security, store your TRACEKIT_API_KEY in an environment variable. During local development, you can use the TraceKit Local UI by installing it globally with:
npm install -g @tracekit/local-ui
Access the local UI at http://localhost:9999 to view traces without needing cloud integration.
Once integrated, you’re ready to explore TraceKit’s powerful debugging tools for capturing dynamic logs, analyzing performance issues, and monitoring anomalies.
Main Debugging Features
TraceKit offers three key features to help you debug and monitor your Django app effectively:
- Dynamic Logs: Use
client.capture_snapshot()to capture variable states and stack traces at specific points in your code without stopping the application. This works seamlessly for both synchronous and asynchronous Django code. - Distributed Tracing: Automatically tracks outgoing HTTP requests from libraries like
requests,urllib, andhttpx. It creates service dependency graphs and uses W3C-complianttraceparentheaders for compatibility with OpenTelemetry tools. - Real-Time Anomaly Detection: Keep an eye on unusual activity like DDoS attacks, traffic surges, or security issues. Configure alerts to notify you via Slack, Telegram, or custom webhooks. You can also replay requests to examine their full lifecycle through sequence diagrams or flame graphs.
The free tier supports up to 200,000 traces per month with a 7-day retention period, making it ideal for apps handling around 100,000 requests daily. If you need more, paid plans start at $29 per month, offering 1 million traces and 30-day retention.
How to Debug Django Apps with TraceKit
Adding Dynamic Logs
TraceKit uses capture points to let you inspect production code without stopping execution or deploying new updates. You simply add a line of code at the desired location, and then manage it remotely through the TraceKit dashboard.
When a capture point is triggered, the SDK gathers information like variable states, request payloads, and headers at that exact moment. This process runs asynchronously and adds less than 5% performance overhead, so your users won’t notice any slowdown. Unlike pdb or breakpoint(), which pause execution, capture points keep your app running smoothly.
For tricky bugs like race conditions or webhook failures that don’t show up in local testing, placing a capture point at the data entry point can be a game-changer. For example, Alex resolved a Stripe webhook issue in just 10 minutes by adding a capture point at the handler where the data was first processed.
TraceKit doesn’t stop at debugging - it also helps uncover performance issues.
Tracing Performance Problems
TraceKit automatically tracks all Django requests, routes, and handlers without requiring any setup. It maps out the flow of requests across your services, giving you a clear picture of how your app operates.
Flame graphs make it easy to visualize function performance. Wider boxes indicate slower operations, while color coding highlights different types of tasks: blue for database queries, purple for external API calls, green for your application code, and red for framework or library code. Watch for these patterns:
- Wide Tower: A single wide box dominating the graph points to a major bottleneck.
- Coral Reef: Numerous small boxes at the same level often signal an N+1 query issue.
- Deep Stack: A very tall stack could mean inefficient recursion.
For instance, a SaaS company used flame graphs to pinpoint a 2,000ms API delay. The culprit? A single function, generatePDF(), taking up 1,600ms. By moving this task to a background job, they reduced the request time to just 300ms.
Once you’ve identified the slow spots, TraceKit’s tools also help you maintain smooth performance moving forward.
Monitoring Metrics and Detecting Anomalies
Keep tabs on critical metrics like requests per minute, latency, uptime, and error rates in real time. TraceKit’s secure monitoring means you can avoid enabling Django’s risky DEBUG = True setting in production.
The platform’s anomaly detection tools are designed to catch problems early. It can identify the root cause of issues like DDoS attacks, sudden traffic surges, or suspicious security patterns. You can even set up webhooks to send alerts to Slack or Telegram for immediate action.
One standout feature is the Request Lifecycle Replay, which visualizes requests as sequence diagrams or flame graphs. This makes it easy to track the order of service calls and see SQL query execution times, giving you a complete view of how a failing request was processed.
TraceKit vs Datadog and Sentry for Small Teams
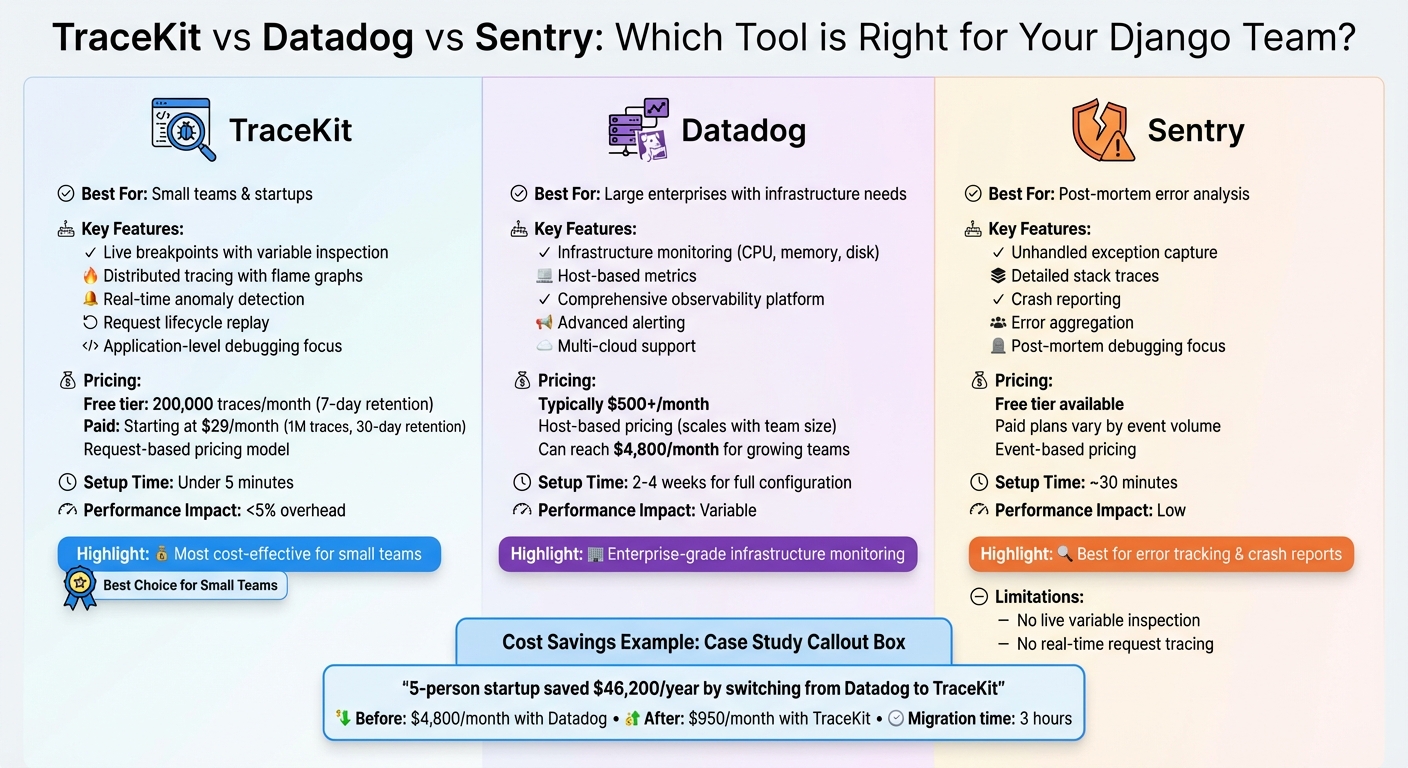
TraceKit vs Datadog vs Sentry: Feature and Pricing Comparison for Django Teams
TraceKit vs Datadog
TraceKit's user-friendly setup and pricing structure make it a strong contender against traditional tools like Datadog, especially for small teams. Datadog's host-based pricing can quickly add up, often exceeding $500 per month as teams grow. In contrast, TraceKit's request-based pricing starts at just $29 per month for up to 1 million traces. This model is particularly beneficial for teams scaling horizontally.
Here’s an example: A 5-person startup reduced its monthly costs from $4,800 to $950 by switching to TraceKit. The migration took only 3 hours and resulted in annual savings of approximately $46,200 [1].
While Datadog excels in infrastructure monitoring - providing insights into CPU, memory, and disk usage - many smaller Django teams don’t require that depth of detail. TraceKit, on the other hand, zeroes in on application-level debugging. Features like dynamic logs, flame graphs, and request tracing help teams resolve bugs faster. Plus, TraceKit's setup usually takes under 5 minutes, a stark contrast to the 2–4 weeks often needed to configure enterprise-level tools like Datadog.
While Datadog focuses heavily on infrastructure, Sentry takes a different route with its error tracking capabilities, making it another tool worth comparing to TraceKit.
TraceKit vs Sentry
When comparing TraceKit to Sentry, the distinction lies in their approach to debugging. Sentry is built for capturing unhandled exceptions and providing detailed stack traces, which can be invaluable for post-mortem analysis. However, it lacks the ability to inspect variable states or perform full request tracing in real time.
TraceKit, on the other hand, shines with its dynamic logs capabilities. It allows teams to inspect issues in real time without requiring redeployment, making it easier to diagnose complex problems like race conditions or unexpected data transformations.
For teams seeking comprehensive visibility, TraceKit can complement Sentry’s crash reporting with its dynamic logs and performance tracing, offering a more complete solution. Together, they provide both proactive and post-mortem insights.
Conclusion
TraceKit simplifies production debugging, eliminating the need for endless print statements, repeated Git pushes, or long CI/CD delays. It allows you to monitor variable states and trace request paths in real time - all without redeploying your application.
With dynamic logs, you gain immediate insight into your app's behavior, making it easier to identify problems like race conditions or malfunctioning webhooks in just minutes. When paired with distributed tracing, bottlenecks like N+1 query issues become much easier to spot and resolve.
Real-time anomaly detection further enhances your troubleshooting toolkit by alerting you to error spikes, potential DDoS attacks, or unexpected traffic surges before they affect your users. These alerts are sent straight to Slack or Telegram, ensuring you can act quickly when needed.
For just $29 a month, TraceKit offers a cost-effective alternative to traditional debugging tools, which can run into tens of thousands of dollars annually. With a setup time of under five minutes and minimal impact on performance, it’s an accessible solution for solo developers and small teams alike.
Skip the log–deploy–wait cycle and discover exactly what's happening in your Django app when it matters most - TraceKit makes it fast, efficient, and affordable.
FAQs
Is TraceKit safe to use in production?
TraceKit is safe to use in production environments. It’s built to function smoothly across various settings - whether local, staging, or live production. This means you can debug issues on the fly without needing to redeploy or risk interrupting your system.
How does dynamic logs work without pausing requests?
Dynamic logging gives developers the ability to capture variable state from running code on the fly - no need to halt the application or redeploy. By using tools like TraceKit, you can monitor variable state and execution context as the code executes, all in real time. This means requests keep flowing, and nothing gets paused.
The real advantage? You can debug directly in production without interrupting the user experience. It keeps everything running smoothly while maintaining uptime and performance.
Does TraceKit capture sensitive user data?
TraceKit focuses on collecting application traces, metrics, logs, and device details while ensuring secure data handling and adherence to privacy policies. However, it does not clearly specify if sensitive user information is included in the data it gathers. For a detailed understanding of its data handling practices, it's best to review the privacy policy directly.
Related Blog Posts
Related Posts

Debug Production Without Redeploying: Step-by-Step Guide
Step-by-step guide to debugging production without redeploying. Set up dynamic logs for PHP, Node.js, Go, and Python in minutes.

Laravel Production Debugging: Beyond Logs and Error Tracking
Debug Laravel in production beyond dd() and Log::info(). Use Telescope, dynamic logs, distributed tracing, and performance profiling.

Why Your Production Logs Never Have What You Need
Why production logs never have what you need and how to fix it. Replace reactive logging with dynamic logs and tracing to cut debug time by 80%.