
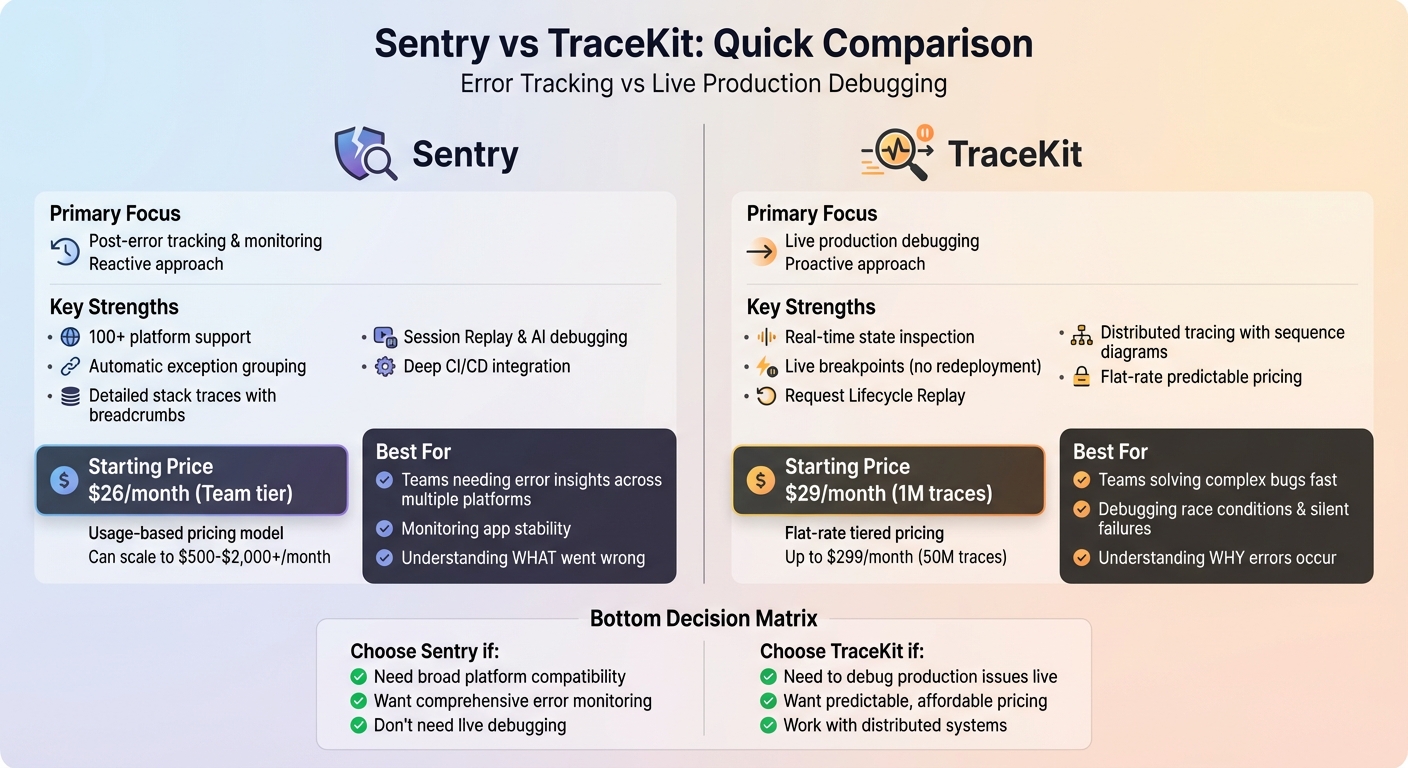
Need to decide between Sentry and TraceKit? Here’s the breakdown:
- Sentry is great for tracking errors after they happen. It organizes issues, provides detailed stack traces, and integrates with tools like GitHub and Slack. Pricing starts at $26/month, but costs can rise with usage.
- TraceKit focuses on live debugging in production. It lets you debug production apps without redeploying, ideal for finding root causes of silent failures or race conditions. Pricing starts at $29/month with predictable, flat-rate tiers.
Quick Comparison
| Feature | Sentry | TraceKit |
|---|---|---|
| Focus | Post-error tracking | Live debugging in production |
| Starting Price | $26/month | $29/month |
| Strength | Broad platform support | Real-time state inspection |
| Best For | Teams needing error insights | Teams solving complex bugs fast |
Choose Sentry if you need to monitor app stability and organize error data.
Choose TraceKit if you need to debug live production issues quickly and cost-effectively.
Keep reading for detailed insights into features, use cases, and pricing!
Sentry vs TraceKit Feature and Pricing Comparison Chart
Top 5 Error Tracking Tools for Developers in 2025
sbb-itb-0fa91e4
Sentry Overview: Error Tracking After Issues Occur
Sentry focuses on monitoring and managing errors after they happen. When an unhandled exception crashes your app or a user encounters a problem, Sentry steps in, automatically logging the event and grouping similar errors into a single issue. This system helps teams stay organized and avoid drowning in individual error reports.
What sets Sentry apart is the depth of its debugging data. Each error log comes with detailed stack traces that highlight the exact point of failure, along with the local variables at that moment. The Breadcrumbs feature is particularly useful, as it creates a chronological trail of user actions and system events – like API calls, button clicks, or navigation paths – leading up to the error. This makes it easier for developers to reproduce bugs without needing extensive user input. By integrating with tools like GitHub or GitLab and uploading source maps, teams can access readable stack traces directly linked to the faulty code. Sentry’s "Suspect Commits" feature even pinpoints the specific commit likely responsible for the issue. Below, we’ll dive into Sentry’s main features and its ideal user base.
Core Features of Sentry
Sentry offers a real-time alerting system that notifies teams the moment an error occurs, escalates in frequency, or reappears after being marked as resolved. These alerts can be delivered via Slack, Discord, PagerDuty, and other channels. The platform also tracks release health, monitoring metrics like crash-free sessions, version adoption rates, and failure rates across deployments. For teams managing distributed systems, Sentry provides distributed tracing, which connects frontend and backend events to show the full sequence of operations leading to an error.
To help teams stay proactive, Sentry allows you to set up metric and anomaly alerts to catch spikes in error rates or performance regressions without needing constant dashboard monitoring. Additionally, it integrates with workflow tools like Jira and GitHub, so teams can create tickets and assign fixes directly from error reports. These features make Sentry a strong fit for teams that prioritize immediate error notifications over live code inspection.
Who Should Use Sentry
Sentry is best suited for teams that need detailed post-error insights across their entire application stack but don’t require live debugging. It’s particularly helpful for organizations working with multiple programming languages and frameworks – like JavaScript, Python, Go, or Ruby – who want a centralized view of production issues. Teams focused on understanding what went wrong and where it happened, rather than diving into real-time variable states, will find Sentry’s approach effective. For those who need deeper tools for investigating why errors occur, alternatives like TraceKit for production debugging may be more appropriate.
TraceKit Overview: Live Debugging in Production
TraceKit brings live debugging to production environments, letting you insert breakpoints and inspect code in real time – without the hassle of downtime or redeployment. It also captures those elusive issues like silent failures, logic bugs, and race conditions that don’t trigger exceptions. For instance, if a checkout process fails or a database query produces unexpected results without crashing the app, TraceKit’s capture points allow you to examine variable states at the exact moment the problem occurs. This eliminates the tedious cycle of adding logs, redeploying, and waiting for results[2].
Powered by OpenTelemetry, TraceKit supports a wide range of languages, including PHP, Node.js, Go, Python, Java, and Ruby (e.g., Laravel, Express, Django, Spring Boot). Installing the SDK takes just one command and less than four minutes, with a production overhead of under 5%[2][3]. This makes it a great fit for high-traffic applications where traditional debugging methods could disrupt operations.
"I spent two days adding logs, redeploying, waiting. Every time I thought I had it, I’d realize I needed to log something else… With TraceKit, time to find the bug: 10 minutes."
- Alex, Solo Founder[2]
Here’s a closer look at the features that make TraceKit so efficient.
Key Features of TraceKit
- Live Production Breakpoints: Also known as "capture points", these let you inspect variable states and execution paths in real time – no code redeployment required. They operate asynchronously to ensure performance isn’t affected[2].
- Automatic Distributed Tracing: With zero-configuration instrumentation, you can visualize request flows across services like PostgreSQL, MySQL, MongoDB, Redis, RabbitMQ, Kafka, and SQS. The Request Lifecycle Replay feature turns these traces into sequence diagrams, making it easier to locate failures or delays in multi-service workflows[2][3].
- Performance Visualization and Anomaly Detection: Tools like flame graphs and service dependency maps help identify bottlenecks, while AI-driven anomaly detection flags unusual patterns. It also captures full SQL queries, provides request waterfall visualizations, and offers suggestions for performance improvements – all based on live production data[2][3].
TraceKit retains data for 7 to 180 days, depending on the plan, with pricing starting at $29/month for 1 million traces[2].
How TraceKit Differs from Error Trackers
TraceKit takes a proactive approach to debugging, setting itself apart from traditional error trackers like Sentry. While error trackers are reactive – logging issues after they occur – TraceKit enables live debugging by collecting capture point data in real time. This approach can debug production issues 10x faster[2].
"TraceKit helped me find performance issues before I released the new version of my framework. I was able to fine-tune everything and fix problems before they hit users."
- Ali Khorsandfard, Creator of Gemvc PHP Framework[2]
This proactive debugging is especially useful for high-traffic applications where adding context via redeployment is risky and time-consuming. It’s also invaluable for identifying race conditions, where traditional logging may miss the mark by executing before the failure occurs. For teams managing distributed systems, TraceKit’s ability to trace requests across services and visualize workflows simplifies the process of pinpointing where interactions break down.
Feature Comparison: Sentry vs TraceKit
Sentry and TraceKit take different paths when it comes to handling production monitoring. Sentry focuses on tracking errors after they occur, offering tools to group exceptions and monitor performance across over 100 platforms. On the other hand, TraceKit is all about live debugging in production – allowing you to inspect running code without needing to redeploy. Think of it this way: Sentry helps you understand what went wrong, while TraceKit dives into why it happened by capturing real-time state data. This comparison highlights how each tool approaches error detection and debugging.
Both tools support distributed tracing but cater to distinct needs. Sentry integrates end-to-end tracing with features like Release Health tracking, while TraceKit emphasizes request-based tracing with session context, tailored for debugging microservices. Their pricing models reflect these differences: Sentry’s usage-based plans start at $26/month for teams, whereas TraceKit offers subscription pricing at $29/month for up to 1 million traces, along with a free tier. TraceKit positions itself as a budget-friendly alternative to enterprise-grade APM tools, which often cost upwards of $500 per month [1].
"Enterprise APM tools cost $500+/month. I built Tracekit as an affordable alternative starting at $29/month with live production debugging."
This breakdown makes it easier to see where each tool shines: Sentry excels at reactive error tracking, while TraceKit is better suited for proactive, real-time debugging.
Feature Comparison Table
| Feature | Sentry | TraceKit |
|---|---|---|
| Primary Focus | Error tracking & full-stack observability | Live production debugging & APM |
| Error Capture | Automatic exception grouping and issue management | Request-based logging with live breakpoints |
| Live Debugging | Session Replay & Profiling (post-hoc analysis) | Live breakpoints with real-time state inspection |
| Distributed Tracing | End-to-end tracing | Request-based tracing |
| Performance Tools | Web/Mobile Vitals, N+1 query detection, database insights | Flame graphs, service dependency maps, SQL capture |
| AI Features | Seer AI Debugging Agent | AI-powered anomaly detection |
| Language Support | 100+ platforms (Next.js, Python, Go, etc.) | PHP, Node.js, Go, Python, Java, Ruby |
| Data Retention | Varies by plan | 7 to 180 days depending on plan |
| Starting Price | $26/month (Team tier) | $29/month (1M traces) |
| Free Tier | Limited features | Free forever with basic features |
As of February 2026, TraceKit has been adopted by over 500 teams [1], making it a solid choice for smaller teams that need cost-effective debugging without the overhead of enterprise tools. Meanwhile, Sentry remains the top pick for robust error tracking across a wide range of platforms. Whether you need comprehensive observability or targeted, real-time debugging depends on your team’s specific needs. The details above should help you decide which tool aligns best with your workflow.
Pros and Cons: Sentry vs TraceKit
Choosing the right tool often comes down to understanding what fits your needs best. Sentry offers broad platform compatibility, supporting over 100 languages and frameworks. This makes it a strong contender for teams working with varied tech stacks. Features like AI-powered root cause analysis and Session Replay add visual clarity to debugging, which can be a game-changer for identifying issues. However, this robust feature set comes with trade-offs. Sentry can be challenging to configure for smaller projects, and its pricing can escalate quickly as data usage increases. For simpler applications, its extensive capabilities might even feel excessive.
On the other hand, TraceKit carves out a niche by focusing on live production debugging at a much lower cost. Priced at $29/month, it’s a budget-friendly alternative to enterprise-level APM tools, which can cost upwards of $500 per month [1]. Its straightforward setup appeals to smaller teams, and the request-based APM model keeps things uncomplicated. The downside? TraceKit offers fewer integrations compared to Sentry, lacks advanced features like profiling and session replay, and has a smaller user community, which might limit external resources and support.
Ultimately, the decision comes down to scope versus simplicity. Sentry provides a comprehensive suite of tools but requires more effort and investment as you scale. TraceKit, with its focused and affordable approach, is better suited for teams prioritizing cost and simplicity, even if it means sacrificing some advanced capabilities.
Comparison Table: Pros and Cons
| Tool | Pros | Cons |
|---|---|---|
| Sentry | Broad platform support (100+), AI-powered root cause analysis, Session Replay, deep CI/CD integration. | Complex setup; pricing increases with data usage; feature set may feel excessive for small apps. |
| TraceKit | Affordable ($29/month), ideal for live production debugging, easy setup for small teams, request-based APM model. | Limited integrations; lacks advanced features like profiling and session replay; smaller community. |
When to Choose Sentry
Here’s when Sentry stands out as the right tool for the job:
Sentry is ideal if you need to track app stability and identify errors after they happen. It integrates easily and starts capturing detailed error data right away. The free tier is a great fit for individual developers or small-scale projects, while its pricing grows in line with your app’s activity, making it cost-effective as your needs expand[4]. Its compatibility with a wide range of platforms makes it a versatile choice for various tech stacks.
Best Use Cases for Sentry
Sentry shines in scenarios where error alerting is the priority, but live debugging in production isn’t required. It groups similar errors, highlights the most impactful issues, and provides the necessary details to investigate – though it doesn’t include live variable inspection[4]. This makes it a strong choice for teams focused on quickly identifying and addressing issues. For example:
- Frontend developers can use it to track JavaScript errors.
- Mobile teams benefit from monitoring crash rates.
- Backend teams can debug problems in controlled environments rather than live production.
Sentry’s approach simplifies understanding what’s breaking, how often it happens, and which users are affected, ensuring teams can act swiftly and effectively.
When to Choose TraceKit
While Sentry focuses on tracking errors after they happen, TraceKit takes it a step further by offering live debugging insights to uncover the root causes. TraceKit is the go-to choice when error tracking alone doesn’t cut it – especially for tackling production issues that don’t trigger exceptions. For example, imagine a webhook returning a 200 status but failing to process the data. Tools like Sentry might not flag this as an error. TraceKit, however, allows you to set capture points in your code, letting you inspect variable states in real time.
This tool is a lifesaver if you’re stuck in the tedious loop of adding log statements, redeploying code, and waiting for your CI/CD pipeline – sometimes a process that eats up 15 minutes or more. Take the case of Alex, a solo founder, who faced a Stripe webhook issue in January 2026. Payments were successful, but subscriptions failed to activate. After two days of manual debugging, Alex added a single TraceKit capture point and pinpointed a race condition caused by an asynchronous database write in just 10 minutes [2].
"I spent two days adding logs, redeploying, waiting. Every time I thought I had it, I’d realize I needed to log something else… Time to find the bug [with TraceKit]: 10 minutes." – Alex, Solo Founder [2]
By speeding up debugging and reducing disruptions during busy periods, TraceKit becomes a game-changer for developers. Let’s explore the scenarios where it truly excels.
Best Use Cases for TraceKit
TraceKit shines in debugging issues that only surface in production environments with live traffic and real-world data. It’s particularly useful in distributed systems. Its Request Lifecycle Replay feature visualizes service calls as sequence diagrams, revealing bottlenecks that traditional error trackers might overlook.
Backend teams facing challenges like race conditions, concurrency problems, or intermittent failures can benefit immensely from TraceKit’s live breakpoints. For example, in November 2025, Terry Osaya, co-founder of TrustyPost, integrated the TraceKit SDK. This allowed automatic tracking of HTTP calls and database queries without requiring manual setup. Similarly, Ali Khorsandfard, the creator of the Gemvc PHP Framework, used TraceKit to fine-tune performance issues before releasing a new version.
"TraceKit helped me find performance issues before I released the new version of my framework. I was able to fine-tune everything and fix problems before they hit users." – Ali Khorsandfard, Creator of Gemvc PHP Framework [2]
TraceKit is also a great fit for small teams and solo developers who need robust debugging tools without the complexity or high costs of enterprise solutions. Adil Ali, a fullstack developer, integrated TraceKit into a Python Flask application in under 15 minutes. He found the platform provided the right level of visibility without overwhelming his team.
"At $29/month, it’s much simpler than Datadog for what we need, without feeling stripped down." – Adil Ali, Fullstack Developer [2]
Pricing Breakdown: Sentry vs TraceKit
Now that we’ve compared their features, let’s dive into how Sentry and TraceKit differ when it comes to pricing.
Sentry operates on a hybrid pricing model, starting at $26–$80 per month for 50,000 errors. Costs increase with usage and add-ons, such as Seer AI at $40 per contributor per month. For high-traffic applications, charges for errors, performance monitoring, and session replays can push monthly costs into the $500 to $2,000+ range. On average, organizations spend anywhere from $500 to $10,000 annually on Sentry [5].
TraceKit, on the other hand, uses a straightforward tiered flat-rate system. Plans start at $29 per month for 1 million traces and go up to $299 per month for 50 million traces. These plans come with predictable costs, as there are no per-user fees. For example:
- Starter Plan: $29/month for 1 million traces with 7-day retention (supports about 100,000 requests per day).
- Growth Plan: $99/month for 10 million traces with 30-day retention (handles 1 million requests per day).
- Pro Plan: $299/month for 50 million traces with 180-day retention (suitable for 5 million requests per day).
All TraceKit plans include unlimited team members, unlimited services, and full access to features.
Pricing Table
| Feature | Sentry (Team/Business) | TraceKit (Starter/Growth/Pro) |
|---|---|---|
| Base Price | $26 – $80+/mo | $29 – $299/mo |
| Pricing Model | Hybrid (subscription + usage) | Flat-rate tiered |
| Volume Included | 50,000 errors/month | 1M – 50M traces/month |
| Data Retention | Up to 90 days | 7 – 180 days |
| AI Debugging | $40/contributor/mo (Seer) | Included in all plans |
| Overages | Pay-as-you-go charges | Limits defined by each plan |
| Team Members | Unlimited | Unlimited |
For small teams, TraceKit’s Starter plan at $29/month offers predictable costs and no overages, making it ideal for teams handling up to 100,000 requests daily. In contrast, Sentry’s Team plan ($26/month) is slightly cheaper but includes only 50,000 errors, which might not suffice for growing applications.
For medium teams, TraceKit’s Growth plan ($99/month) stands out as a better deal compared to Sentry’s Business plan ($80/month), especially when you factor in Sentry’s additional charges for AI debugging and higher data volumes.
For large teams, TraceKit’s Pro plan at $299/month keeps costs predictable with its flat-rate pricing. Meanwhile, Sentry’s Enterprise plan requires custom quotes, and Business plan costs can scale unpredictably depending on usage.
While Sentry offers a robust feature set tailored for large-scale applications, its pricing complexity may not suit every team. TraceKit’s transparent and predictable pricing makes it a strong choice for teams that value cost control and simplicity in debugging.
Which Tool Should You Choose?
After comparing pricing, the next step is to weigh each tool’s features against your team’s specific needs and size. If you’re looking for broad post-error monitoring, Sentry might be your go-to. On the other hand, if live debugging during production is a priority, TraceKit could be the better fit, depending on your budget and requirements.
For smaller teams focused on keeping costs down while ensuring quick debugging, TraceKit’s Starter plan is a solid choice. It offers 1 million traces and live debugging for just $29/month. For larger organizations needing advanced integrations across over 100 platforms, Sentry provides a robust ecosystem for error monitoring, though its pricing structure is more complex.
Key Takeaways
Here’s a quick guide to help you decide between the two tools:
Choose Sentry if your primary need is error monitoring across a wide range of platforms. It’s perfect for tracking what went wrong, when it happened, and how frequently – especially if live debugging isn’t a top priority.
Choose TraceKit if you need to resolve production issues quickly without redeploying. It’s designed for teams that need to set live code breakpoints, trace requests through microservices, and dig into root causes – all with a straightforward flat-rate pricing model. This makes it especially useful for smaller teams working with AI-generated code from tools like Cursor or Copilot.
FAQs
Can I use Sentry and TraceKit together?
Yes, Sentry and TraceKit work well together as a powerful combo for handling errors. Sentry excels at tracking errors and monitoring performance after issues arise. On the other hand, TraceKit offers advanced debugging tools like live breakpoints and request tracing, even in production, without needing to redeploy. By combining the two, you can use Sentry to identify and track errors, then rely on TraceKit to debug them in real-time, creating a well-rounded solution for resolving issues effectively.
How safe are live breakpoints in production?
Live breakpoints in production can be safe, but only when handled with the right precautions. This includes measures like restricting access to authorized personnel and carefully controlling the environments where they’re deployed. Tools such as TraceKit help reduce risks by offering secure debugging features like AI-powered observability and live variable capture.
That said, there are still valid concerns to keep in mind – performance impact, potential data exposure, or system instability. These tools are best used by experienced teams who can ensure they’re implemented in secure, well-monitored systems.
What’s the real cost difference at high traffic?
When it comes to handling high traffic, the cost difference largely hinges on scalability and pricing structures. Sentry operates on a model where charges are tied to error volume, meaning costs can spike as traffic – and errors – increase. On the other hand, TraceKit offers advanced features like live breakpoints and real-time debugging, which can help cut long-term costs by reducing the need for frequent redeployments. However, it’s worth noting that TraceKit might come with higher upfront expenses due to setup and infrastructure requirements.
In essence, Sentry is a better fit for straightforward error tracking needs, while TraceKit is designed for more complex applications that demand in-depth debugging capabilities.