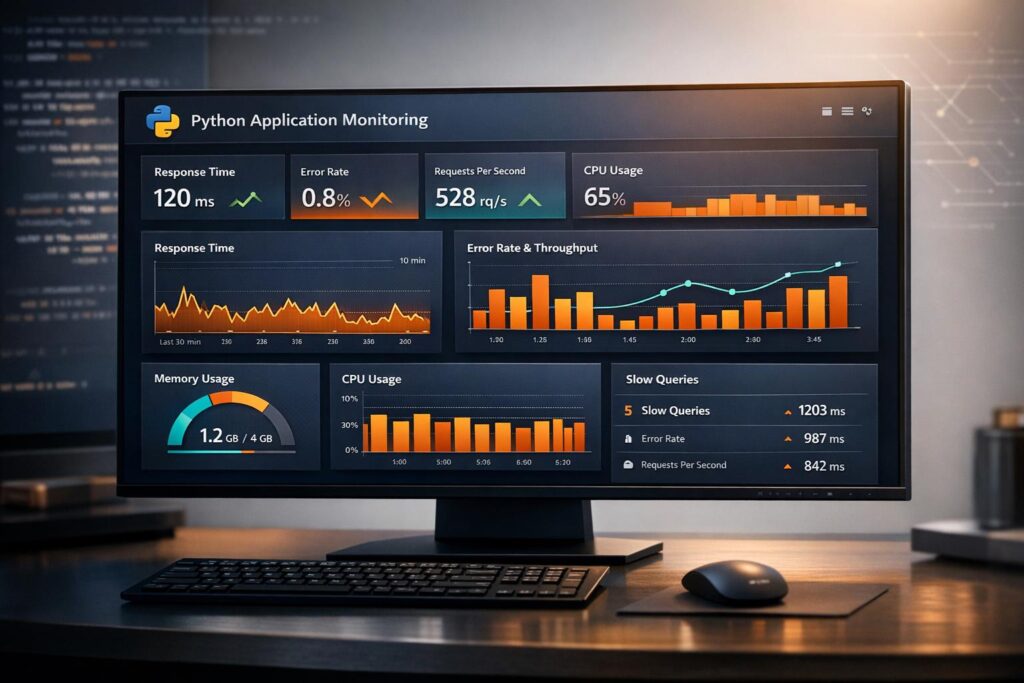
Monitoring Python applications in real time helps you detect and address performance issues instantly. By tracking key metrics like latency, error rates, and resource usage, you can ensure your application stays reliable and responsive. Tools like OpenTelemetry and TraceKit simplify this process with features like automatic instrumentation, distributed tracing, and AI-powered anomaly detection.
Key Takeaways:
- Why It Matters: Real-time monitoring identifies bottlenecks (e.g., Global Interpreter Lock) and detects errors immediately after deployment.
- Core Metrics to Track:
- Latency (p95, p99): Pinpoints slow user experiences.
- Error Rates: Tracks exceptions and HTTP 5xx responses.
- CPU, Memory, and I/O Wait: Highlights resource bottlenecks.
- Python-Specific Indicators: Garbage collection, GIL contention, and memory allocation.
- Instrumentation Options:
- Zero-Code: Minimal effort, automatic telemetry collection.
- Programmatic: Moderate effort, allows some customization.
- Manual: High effort, full control over monitoring.
- AI-Driven Alerts: Detect anomalies by comparing real-time data to historical baselines, reducing unnecessary notifications.
- Cost Management: Limit label cardinality and use sampling strategies to control monitoring expenses.
With tools like TraceKit, you can streamline monitoring, identify performance issues early, and maintain efficient operations, all while managing costs effectively.
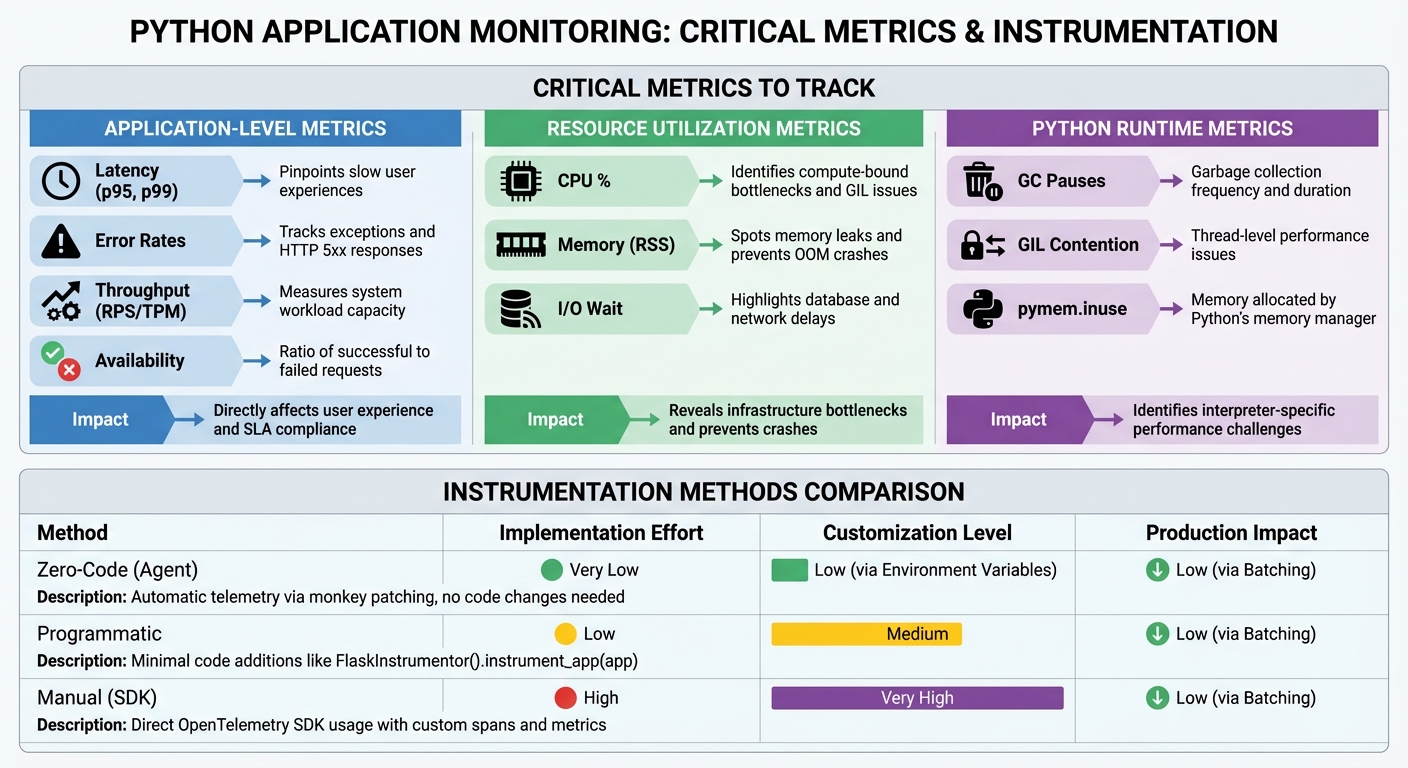
Python Application Monitoring: Critical Metrics and Instrumentation Methods Comparison
Critical Metrics for Python Application Monitoring
Application-Level Metrics
When it comes to monitoring the health of your Python application, metrics like latency, error rates, and throughput are at the core. Measuring latency in percentiles – specifically p95 and p99 – helps you uncover "tail latency" issues that impact your slowest users [7]. For instance, while the average request might complete in 200 ms, if the p99 latency is 5 seconds, one out of every 100 users could face a significant delay. Error rates, which track exceptions, HTTP 5xx responses, and stack traces, provide insight into code quality and system stability. Throughput, measured in requests per second (RPS) or transactions per minute (TPM), shows whether your system can handle its current workload. Another key metric is availability, calculated as the ratio of successful to failed requests, which is crucial for meeting Service Level Agreements (SLAs) [8].
"Python performance monitoring doesn’t have to be all-or-nothing. Start simple – track what impacts your users."
– Anjali Udasi, Content Creator, Last9 [7]
Monitoring in-progress requests can also shed light on issues like concurrency bottlenecks or stalled processes [3]. To simplify querying and aggregation, use labeled metrics such as http_responses_total{code="500"} instead of creating separate metrics for each error type [3].
Next, let’s look at how system resource metrics can complement these application-level insights.
Resource Utilization Metrics
CPU usage is a key indicator of compute-bound bottlenecks, especially when dealing with the Global Interpreter Lock (GIL) or inefficient loops [7]. Even in multi-core systems, a CPU-bound Python application using multiple threads might only max out one core due to GIL constraints. Memory metrics, such as heap size, Resident Set Size (RSS), and allocation rates, are critical for spotting memory leaks and avoiding Out of Memory (OOM) errors that could crash your application. Additionally, I/O wait times can highlight delays caused by database queries or network responses, which are common in synchronous Python code [7][5].
For example, Probo reduced its monitoring costs by 90% by switching to a unified observability platform that efficiently handles high-cardinality Python metrics. The overall monitoring overhead stayed below 5% [7].
Python-Specific Performance Indicators
Python applications also require monitoring metrics tailored to the interpreter itself. Key indicators include garbage collection (GC) frequency, GIL contention, and memory allocated by the pymalloc memory manager [9][7]. High GC overhead or "stop-the-world" pauses can lead to spikes in tail latency (p99) [7][4]. For applications relying on thread pools, monitoring queued requests, active threads, and task wait times can provide valuable insights.
Python 3.11 introduced performance boosts ranging from 10% to 60% compared to version 3.10, which can significantly impact baseline resource usage [7]. If you’re using web servers like Gunicorn or uWSGI, consider registering a post_fork hook to assign each worker process a unique service.instance.id, ensuring accurate metric aggregation [2]. Additionally, Python’s built-in tracemalloc module can be used to take memory snapshots, allowing you to pinpoint the exact file and line responsible for memory leaks by comparing snapshots [9][7].
| Metric Category | Key Indicators | Impact |
|---|---|---|
| Application-Level | Latency (p95, p99), Error Rates, Throughput (RPS/TPM) | Directly affects user experience and SLA compliance [7] |
| Resource Utilization | CPU %, Memory (RSS), I/O Wait | Highlights infrastructure bottlenecks and prevents crashes [7] |
| Python Runtime | GC Pauses, GIL Contention, pymem.inuse |
Identifies interpreter-specific performance challenges [9][7] |
Instrumenting Python Applications for Real-Time Monitoring
Instrumentation Methods for Python
When it comes to instrumenting Python applications, there are three main approaches you can choose from, each with its own level of effort and flexibility.
Zero-code instrumentation is the easiest route. It uses an agent that applies monkey patching to modify library functions at runtime. This automatically gathers telemetry data from frameworks like Django and Flask without requiring any changes to your codebase [11][12]. To get started, simply run opentelemetry-bootstrap -a install. This command detects and installs the necessary instrumentation libraries for all packages in your environment [11][12].
Programmatic instrumentation strikes a balance between simplicity and control. It involves adding minimal code, such as FlaskInstrumentor().instrument_app(app), to enable tracking. This method also allows for some customization, like excluding specific URLs from monitoring [14].
Manual instrumentation offers the most control but requires significantly more effort. By directly using the OpenTelemetry SDK, you can explicitly wrap code blocks with spans and create custom metric instruments [10]. While this approach is the most labor-intensive, it gives you complete flexibility over what gets tracked.
Here’s a quick comparison of these methods:
| Instrumentation Method | Implementation Effort | Customization Level | Production Impact |
|---|---|---|---|
| Zero-Code (Agent) | Very Low | Low (via Env Vars) | Low (via Batching) |
| Programmatic | Low | Medium | Low (via Batching) |
| Manual (SDK) | High | Very High | Low (via Batching) |
For both automated and manual approaches, it’s crucial to use batch processors in production environments to minimize runtime overhead. For example, use BatchSpanProcessor for traces and BatchLogRecordProcessor for logs. These processors export telemetry data in batches, avoiding the performance hit of sending data one piece at a time [10][13]. Additionally, if you’re using process-based servers like Gunicorn, make sure to include the process ID (PID) in your service.instance.id to prevent time-series data collisions [13].
Using TraceKit for Python Observability
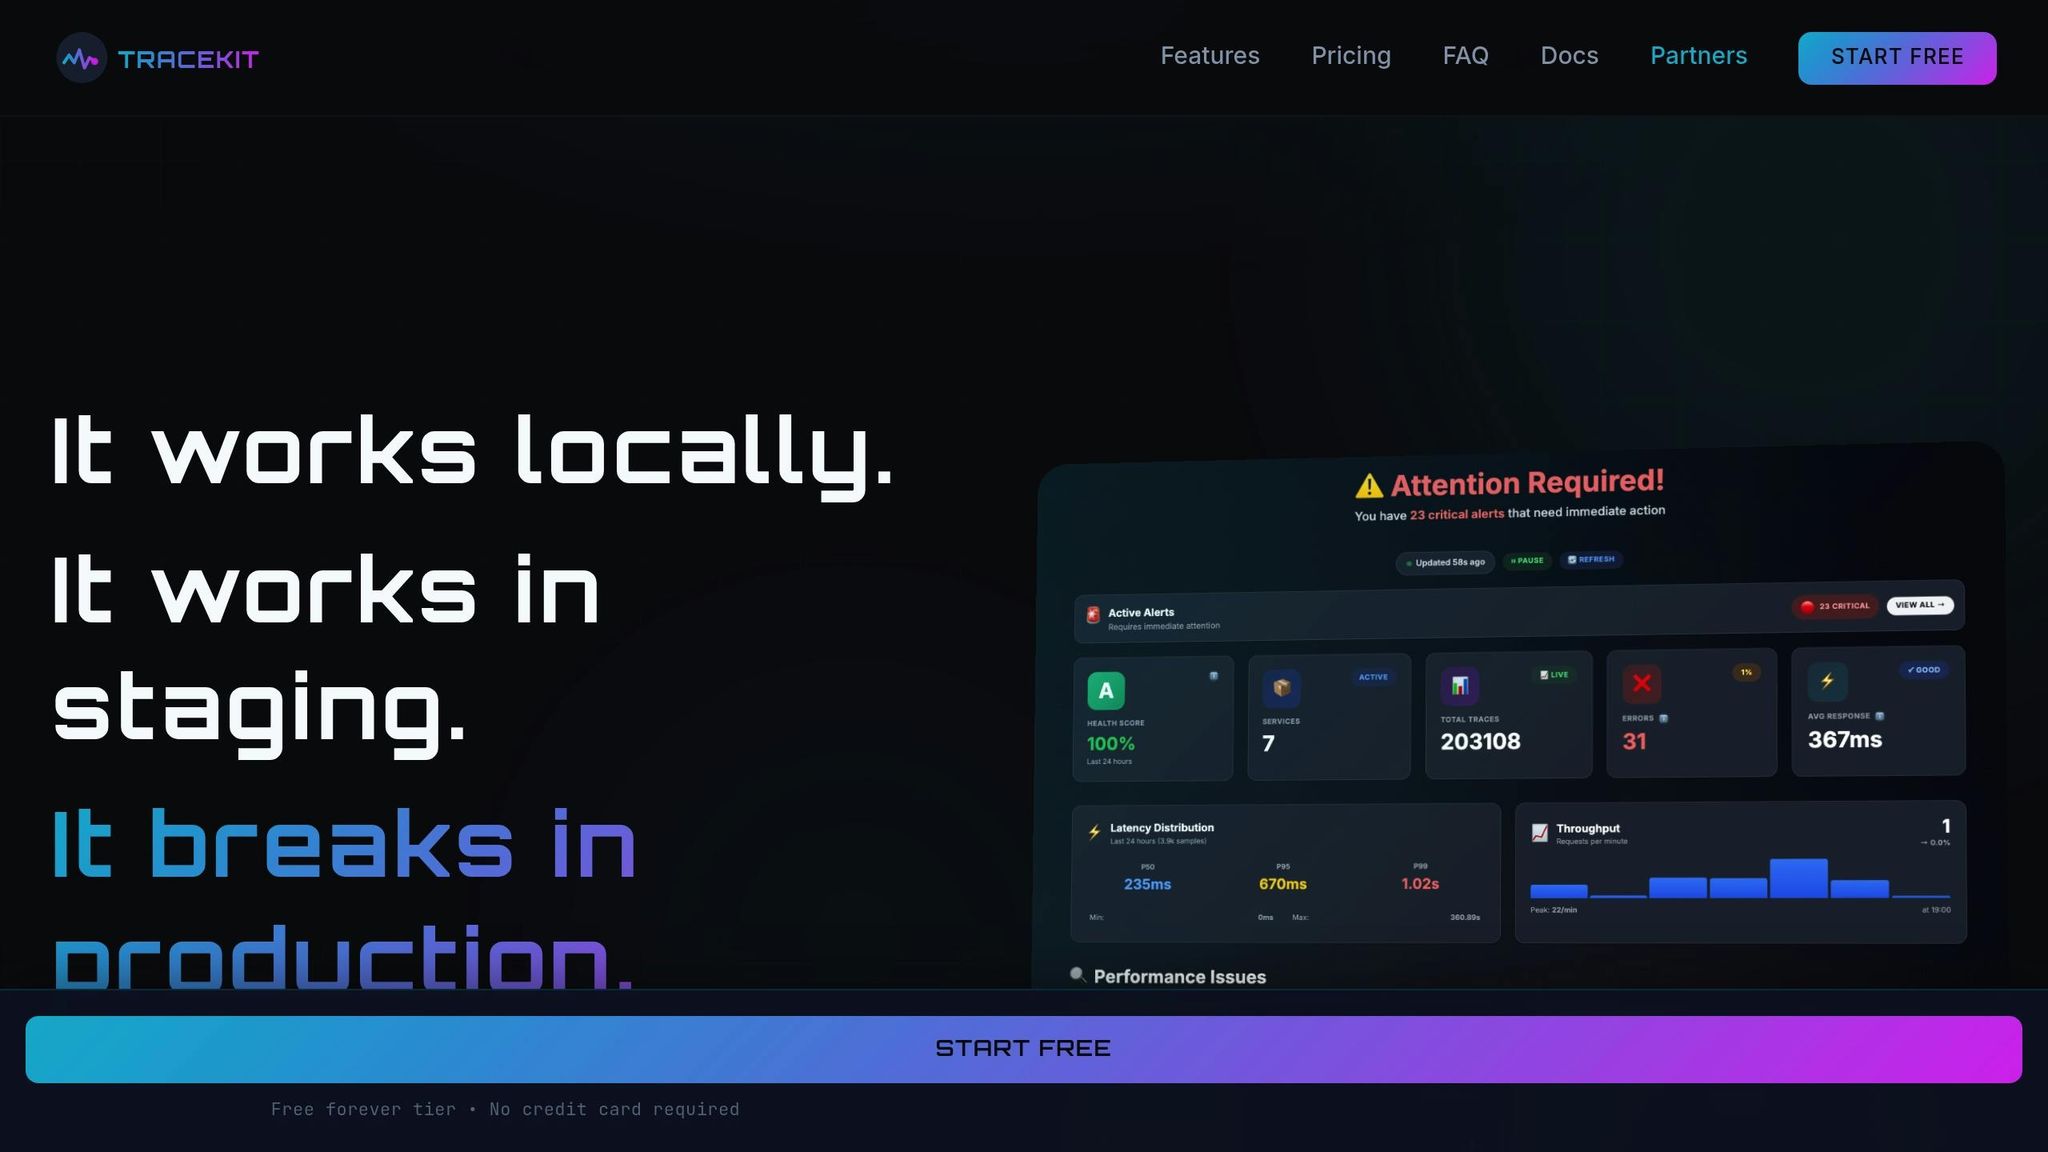
TraceKit simplifies observability for Python applications with its zero-configuration setup. Forget about manual code changes – this platform handles automatic instrumentation for you. It captures distributed traces across services, correlates logs with traces by injecting traceID and spanID, and even provides flame graphs to visualize performance.
One standout feature is live breakpoints, which let you capture variable states without redeploying your application. This is incredibly useful for debugging issues that only appear under real-world conditions. TraceKit also tracks database queries, capturing full SQL statements, and offers request waterfall visualizations to help pinpoint bottlenecks.
To stay ahead of potential problems, TraceKit uses AI to analyze trace patterns and alert you to performance issues before they escalate. Pricing starts at $29 per month for 1 million traces with a 30-day retention period. Whether you’re a small team handling 100,000 requests daily or managing high-traffic applications with up to 5 million requests per day, TraceKit scales to meet your needs.
Production-Safe Instrumentation Practices
For smooth production monitoring, there are a few best practices to keep in mind. First, limit label cardinality to fewer than 10 for most metrics. High-cardinality labels, like unique user IDs, can significantly increase RAM, CPU, and network usage, driving up costs and slowing down query performance [3]. For performance-critical code executed more than 100,000 times per second, reduce the number of metrics being updated and avoid complex label lookups to prevent latency spikes [3].
Deploying an OpenTelemetry Collector is another smart move. This tool aggregates traces and metrics, reducing the load on individual exporters and centralizing the processing across your services [1]. To protect sensitive data, use environment variables like OTEL_INSTRUMENTATION_HTTP_CAPTURE_HEADERS_SANITIZE_FIELDS to redact information such as PII or session keys before exporting headers [14].
For structured logging, configure Python’s standard logging module to output logs in JSON format. Pair this setup with python-json-logger and opentelemetry-instrumentation-logging to automatically link logs with trace data [13].
Finally, when exporting Unix timestamps, let the monitoring backend calculate durations using a formula like time() - my_timestamp_metric. This prevents issues with stuck update logic and ensures accurate time calculations [3].
AI-Powered Anomaly Detection and Alerting
How AI Detects Anomalies
AI-based monitoring systems rely on historical baselines to track key metrics like request volume, error rates, and latency [4]. By using machine learning, these systems compare real-time data against those baselines while accounting for trends, such as the natural rise in traffic during US business hours (9:00 AM–5:00 PM EST) or typical Monday spikes. This ensures that only true anomalies are flagged [15].
To get the best results, it’s important to configure seasonality settings – daily, weekly, or monthly – so the AI can identify your application’s normal traffic patterns and avoid unnecessary alerts during predictable high-traffic periods [15]. These systems can even link performance issues to specific events, like faulty deployments, by analyzing regressions tied to new Python service versions. This pinpoint accuracy helps identify the exact code changes causing the issue [6].
Benefits of AI-Driven Alerts
AI-driven alerts significantly reduce the noise caused by excessive notifications. They achieve this by grouping related incidents and performing automated root cause and impact analyses [4][15]. Instead of sending hundreds of alerts for a single widespread problem, the system consolidates them into one actionable notification. This not only simplifies troubleshooting but also provides insights into why the anomaly occurred. Tools like TraceKit take this a step further by analyzing trace patterns to highlight potential performance issues before they escalate.
These smarter alerting processes make it easier to customize configurations to match the needs of US-based teams.
Configuring Alerts for US-Based Teams
For teams operating in the US, it’s crucial to set up alerts with time zone awareness. Schedule downtimes during off-peak hours to avoid disruptions at inconvenient times, like 3:00 AM. Critical alerts can be routed to systems like PagerDuty, while non-urgent updates can go to Slack or email [15][16]. Use anomaly monitors that adapt to traffic patterns and trigger alerts only for genuine deviations. Adding template variables – such as the affected service, environment, or error count – provides extra context. Additionally, unified service tagging ensures that alerts are directed to the appropriate US-based team for faster resolution.
sbb-itb-0fa91e4
Building a Real-Time Monitoring Stack
Designing an Observability Architecture
A well-structured monitoring stack starts with Python services that generate telemetry data – metrics, traces, and logs – using the OpenTelemetry Protocol (OTLP). This vendor-neutral setup allows you to change your backend without altering your application code. The architecture is typically divided into three layers: Python applications emitting telemetry data, an OpenTelemetry Collector to process and aggregate that data, and a centralized backend for analysis.
The OpenTelemetry Collector acts as a shared processing hub, reducing the burden on individual services by aggregating, filtering, and exporting telemetry. In environments with multiple services, the Collector becomes indispensable. It not only offloads processing tasks from your applications but also serves as a single routing point for sending data to visualization tools and dashboards. To ensure comprehensive monitoring, your Python services should use zero-code automatic instrumentation for standard frameworks like Flask, Django, or Requests, combined with manual instrumentation for custom business logic. This combination creates parent-child span relationships that trace the complete request flow.
When deploying multi-process web servers such as Gunicorn or uWSGI, it’s crucial to configure post-fork hooks to initialize telemetry providers within each worker process. Assigning a unique service instance ID to each worker (e.g., using the process ID) prevents metric collisions in multi-process setups. Once this architecture is in place, integrating an observability tool like TraceKit becomes straightforward.
Using TraceKit for Real-Time Performance Monitoring
TraceKit seamlessly integrates into your monitoring stack, offering automatic instrumentation for widely used Python frameworks. Once your services are instrumented, they send telemetry data via OTLP exporters to TraceKit’s backend. From there, you can use features like flame graphs to visualize request flows, service maps to analyze dependencies, and trace-log correlation by embedding trace and span identifiers in structured JSON outputs.
TraceKit also includes AI-driven anomaly detection, which identifies performance issues by analyzing trace patterns before they affect users. Another standout feature is its live breakpoint capability, enabling you to capture variable states in production code without redeploying. For teams based in the U.S., TraceKit offers flexible pricing. The Starter plan begins at $29 per month for 1 million traces with 30-day retention, ideal for applications handling around 100,000 requests daily. The Growth plan, at $99 per month, supports 10 million traces (approximately 1 million requests daily). For high-traffic applications managing about 5 million requests daily, the Pro plan provides 50 million traces with 180-day retention at $299 per month.
Balancing Cost and Data Retention
Keeping costs under control in a monitoring stack often comes down to managing metric cardinality and retention periods. High cardinality in labels can significantly increase resource consumption. For example, monitoring a metric like node_filesystem_avail across 10,000 nodes might generate 100,000 time series. Adding high-cardinality labels, such as user IDs, could push this into the millions, overwhelming your system.
Shorter data retention periods can help reduce storage expenses but may limit your ability to perform long-term trend analysis or capacity planning. TraceKit’s Starter plan offers a 30-day retention period, while the Pro plan extends this to 180 days, enabling more detailed historical analysis. Sampling strategies can also help control costs – retain all error traces while collecting only a fraction of routine traces. Additionally, exporting timestamps as absolute Unix values rather than relative durations ensures accurate duration calculations, even if update logic experiences delays.
Prometheus Documentation: "The additional resource cost of instrumentation is far outweighed by the benefits it brings to operations and development."
Real-time CPU Performance Monitoring and Logging with Python and SQL Server
Improving Python Application Reliability with Real-Time Monitoring
Real-time monitoring plays a crucial role in enhancing the reliability of Python applications by establishing performance benchmarks across libraries, subsystems, and services. With this approach, teams can monitor key metrics like query volume, error rates, and latency across various service types – whether you’re dealing with online-serving systems, offline-processing pipelines, or batch jobs. These benchmarks not only help in identifying performance bottlenecks but also guide teams toward making targeted improvements.
The benefits of this approach are significant. By tracking hits, errors, and latency for every deployed version, teams can spot regressions immediately. Monitoring tools also group application errors and stack traces into prioritized issues, making it easier to focus on what matters most. For asyncio-based applications, tracking concurrent tasks helps identify slow code paths. Continuous profiling further enhances performance by identifying CPU and memory usage issues, as well as Global Interpreter Lock (GIL) contention, all while keeping the profiling overhead low [4].
TraceKit takes these capabilities a step further by integrating automated instrumentation with advanced features like flame graphs, service dependency maps, and trace-log correlation. Its AI-driven anomaly detection scans trace patterns to catch performance issues early. Plus, its live breakpoint feature allows developers to capture variable states in production environments without needing to redeploy.
Cost efficiency is another critical aspect of reliable monitoring. Managing metric cardinality and retention ensures visibility without overspending on resources. For instance, keeping label cardinality under 10 for most metrics helps control resource usage. TraceKit’s tiered pricing model reflects this balance: the $29 per month Starter plan includes 30-day retention for applications handling roughly 100,000 daily requests, while the $299 per month Pro plan offers 180-day retention for high-traffic applications managing about 5 million daily requests. This structure ensures you’re only paying for the data storage and analysis you actually need.
FAQs
How does real-time performance monitoring enhance the reliability of Python applications?
Real-time performance monitoring gives you a clear, ongoing view of how your Python application is performing. By keeping an eye on metrics, traces, and logs, it helps spot problems like latency spikes, rising error rates, or unexpected resource consumption right as they happen. This means developers can jump in and address issues without delay.
With the help of AI-powered anomaly detection, you can pinpoint and fix performance bottlenecks before they turn into bigger problems. This kind of proactive monitoring helps keep your application running smoothly, minimizes downtime, and boosts its reliability in production settings.
How do AI-driven alerts improve performance monitoring for Python applications?
AI-powered alerts elevate performance monitoring by transforming it from a reactive process into a proactive, intelligence-driven system. Using machine learning, these alerts continuously analyze metrics, logs, and traces in real time to uncover unusual patterns that might slip past human observation. This means potential issues can often be identified and addressed before they affect users, giving teams the opportunity to resolve problems – or even automate fixes – before they escalate.
Beyond just speed, these alerts excel at minimizing noise. They filter out irrelevant notifications and link related issues across complex, distributed systems. By learning the typical behavior of each component, they only flag significant deviations, reducing false alarms and cutting down on unnecessary manual checks. The result? Engineers can zero in on critical incidents, resolve issues faster, and dedicate more time to creating new features instead of constantly troubleshooting.
How can I monitor the performance of Python applications in real time?
Monitoring Python applications in real-time can be done with a variety of methods, tailored to suit your specific requirements and goals.
For a fast and straightforward setup, automatic instrumentation tools are a great choice. These tools integrate seamlessly with popular frameworks like Flask, Django, or FastAPI. They collect telemetry data – such as traces, metrics, and logs – with minimal effort on your part. This means you can start monitoring your application within just a few minutes, without diving deep into your code.
If you need more granular insights, manual instrumentation offers greater control. This method lets you monitor specific functions or sections of your code by defining custom metrics, adding attributes, and logging structured data. It’s an excellent way to gain precise visibility into how your application behaves under different conditions.
For those focusing on metrics, Prometheus-style instrumentation is a powerful option. This approach involves embedding counters, gauges, and histograms directly into your code. By doing so, you can closely link metrics to their source, making it easier to pinpoint and resolve issues.
By blending these techniques, you can build a comprehensive monitoring system that works equally well for small scripts and large-scale Python applications. This ensures your software runs smoothly and reliably.