Debugging Latency Issues Without Redeploying
Fix production latency without redeploying. Use dynamic logs to monitor code in real time, capture variable states, and trace slow request flows.

Fixing latency issues in production doesn’t have to involve redeploying your application. Instead, using dynamic log tools like TraceKit can help you identify and resolve problems without disrupting your service. These tools allow you to monitor code behavior in real time, capture variable states, and analyze request flows - all without pausing or restarting your application.
Key Takeaways:
- Latency in production often stems from slow database queries, inefficient code, or infrastructure bottlenecks.
- Redeploying to fix issues can be slow, risky, and may erase critical debugging data.
- Dynamic logging let you debug running code by collecting stack traces and variable data without stopping execution.
- AI-powered tools like TraceKit analyze captured data to pinpoint root causes and suggest fixes.
Why This Matters:
Traditional debugging methods rely on adding logs and redeploying, which wastes time and risks introducing new problems. By using dynamic logs, you can quickly identify and fix latency issues while keeping your application running smoothly. Tools like TraceKit simplify this process by offering features like request tracing, flame graphs, and service dependency maps, giving you actionable insights to improve performance.
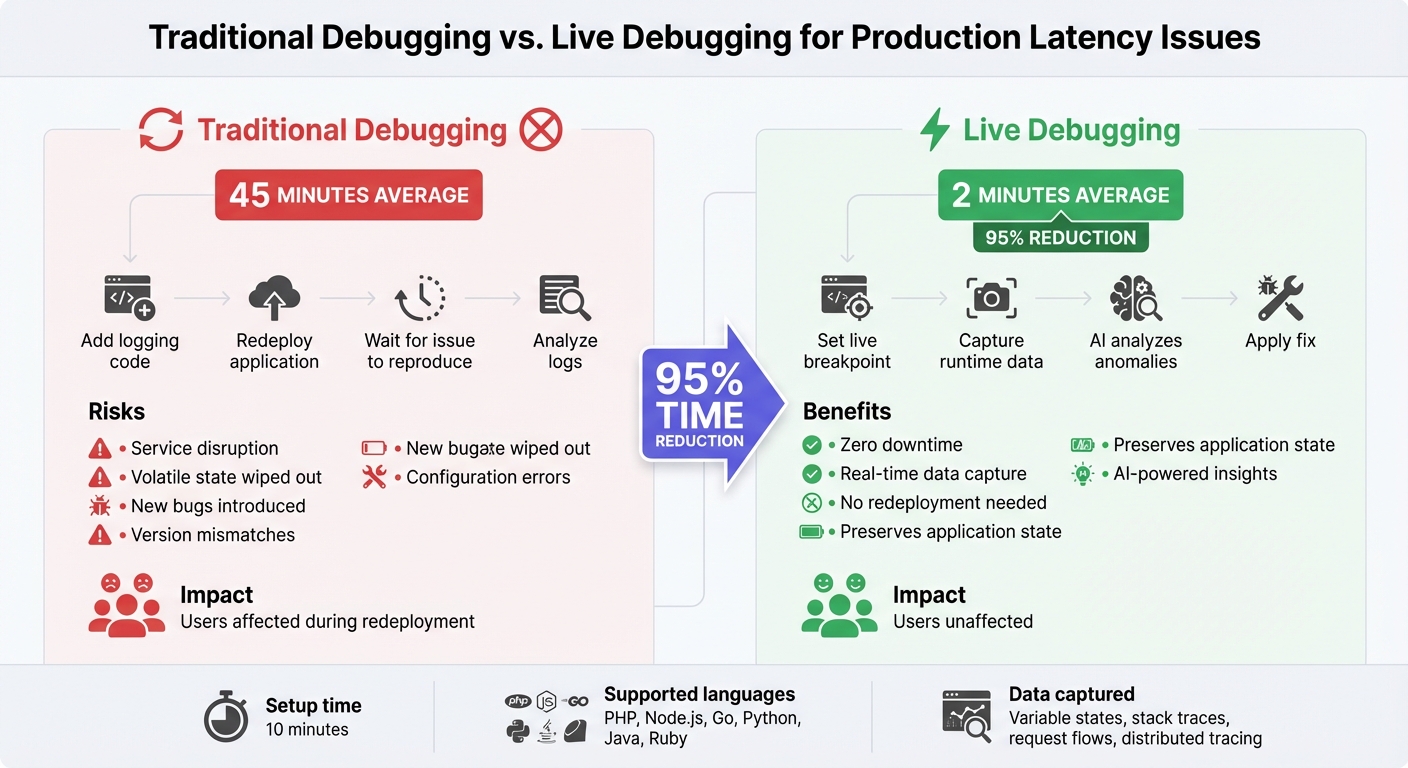
Traditional Debugging vs Dynamic Logs: Time and Risk Comparison
Dynamic Logs the Changelog's Production Kubernetes | Rawkode Live
Understanding Latency in Production
Latency refers to the time it takes for an application to respond in live environments [3]. It’s a key performance metric because delays - like slow page loads or unresponsive APIs - are immediately noticeable to users and can negatively affect their experience [3].
In production, latency acts as a vital health check for your system. Unlike controlled testing environments, production systems face unpredictable traffic and large-scale operations [7]. For instance, a database query that runs smoothly during testing might struggle under heavy load in production. Let’s dive into the common causes of these delays.
Common Sources of Latency
Several factors can contribute to latency issues. One major culprit is database performance. Slow queries, lock contention (when multiple processes compete for the same data), and frequent write operations can create significant bottlenecks. Modern databases like MySQL monitor over 260 telemetry metrics, underscoring the complexity of maintaining performance in live systems [7].
Another frequent cause is inefficient code. High CPU usage from background threads, memory-heavy tasks like large sorting operations, and long-running transactions can all slow down an application [5][7]. In distributed systems, service dependencies often add to the problem. For example, an e-commerce checkout process might rely on over 20 individual service calls [6]. If even one downstream service - whether it’s an external payment API or an internal microservice - slows down, the entire process can be affected.
Network and infrastructure issues also play a role. Idle client connections, cache misses that lead to expensive disk reads, and "noisy neighbor" effects in containerized environments - where unrelated services compete for shared resources - can all result in unpredictable slowdowns [7][8]. These challenges highlight why traditional ways to debug production apps without redeploying are often overlooked, as redeployment frequently fails to resolve latency problems efficiently.
Why Redeploying Makes Latency Issues Worse
When latency issues arise, redeployment might seem like a quick fix, but it often does more harm than good. Adding more logging and redeploying the application takes time, which prolongs the impact on users [2][5]. On top of that, redeployment wipes out volatile state, making it harder to diagnose the root cause [2][5].
"A production bug is the worst; besides impacting customer experience, you need special access privileges, making the process far more time-consuming" [1].
Redeployment also introduces its own risks. Every deployment comes with the potential for new problems, such as version mismatches or configuration errors. In some cases, the original issue may not even reappear in the new environment, leaving the root cause unresolved and the system still vulnerable.
How Dynamic Logs Work
Dynamic logging let you debug production code without the hassle or risks of redeploying. They take snapshots of your application's state at specific points in the code, all without pausing execution or impacting users. This means you can diagnose problems while your application keeps running smoothly. By capturing this runtime data, dynamic logs help bridge the gap between raw information and actionable solutions, paving the way for AI-powered analysis.
What Are Dynamic Logs?
Dynamic logging uses log points, markers you add in your source code to monitor runtime behavior. Like an IDE breakpoint but without halting the application, log points work in the background. They collect details about the current execution state, including local and global variables, stack traces, process data, and distributed tracing context - all without stopping the application or redeploying. Developers can even set conditions for these log points, so they only fire when specific criteria are met.
In May 2025, TELUS, a major telecommunications company, adopted dynamic logs to tackle tricky production bugs. Dana Harrison, their Principal Site Reliability Engineer, led the effort to use dynamic logs across thousands of service instances. This approach slashed their debugging time from 45 minutes to just 2 minutes.
"With Live Debugger, what used to take us 45 minutes now takes just 2 minutes - a 95% reduction in debugging time. This tool has helped redefine how we approach and resolve complex application bugs." [9]
To ensure performance isn't compromised, dynamic logs come with safeguards like rate-limiting and automatic deactivation once preset thresholds are reached. These snapshots not only help developers debug faster but also provide a foundation for AI to analyze and detect anomalies in real time.
How AI Improves Observability
AI takes the data captured by dynamic logs and elevates it to the next level. By instantly identifying anomalies - like unexpected CPU usage or sudden latency spikes - modern observability platforms can link these issues directly to the relevant code-level snapshots [5]. Instead of manually combing through logs, AI pinpoints the root cause in seconds, saving time and effort.
This combination of real-time data capture and intelligent analysis speeds up troubleshooting, so you can fix issues faster while keeping your production environment stable.
Step-by-Step Guide to Debugging Latency with TraceKit
TraceKit provides a hands-on way to tackle latency issues in production environments without needing to redeploy. Supporting languages like PHP, Node.js, Go, Python, Java, and Ruby [10][4], it’s a tool designed for efficiency. Many users note that getting started with TraceKit takes as little as 10 minutes.
Setting Up TraceKit
To install TraceKit, you can use the following CLI command:
brew install Tracekit-Dev/tap/tracekit
Alternatively, install it via a curl script and initialize it with:
tracekit init
This command automatically detects your framework - whether it's Laravel, Express, Django, or Gemvc - and sets up the SDK. The SDK takes care of instrumentation, capturing HTTP calls and database queries without requiring manual adjustments.
Terry Osayawe, Co-Founder at TrustyPost, shared his experience:
"Setup took about 10 minutes - just added the SDK to TrustyPost." [12]
Once installed, restart your application to activate the instrumentation. You can then narrow down your debug session to specific instances, process groups, or Kubernetes namespaces, helping you pinpoint exactly where latency is occurring [2]. After that, configure capture points to start monitoring latency in real time.
Tracing Requests and Capturing Data
With TraceKit up and running, you can enhance dynamic logs by collecting detailed request data. Add a single TraceKit capture point in areas of your code where you suspect slowdowns [12]. These capture points gather variable states, request payloads, headers, and stack traces at the moment they’re triggered - without interrupting your application.
The Request Flame Graph provides a detailed breakdown of each request, showing how much time each operation takes. For instance, you might discover that a db.query() call lasts 124ms, while a Redis cache hit only takes 45ms [12]. This detailed view makes it easier to pinpoint which function or database query is causing delays. Additionally, you can replay each request as a sequence diagram, which visualizes the order and duration of service calls. This feature is especially helpful for identifying failure points or unexpected delays [12].
Finding Dependencies and Bottlenecks
TraceKit’s service dependency map gives you a real-time overview of how requests flow through your microservices. Using color codes (green, yellow, red), it highlights unhealthy or slow components [13], making it easier to spot architectural issues like circular dependencies or single points of failure.
The platform also generates correlation IDs to track requests across your entire system [11]. By searching combined logs for a specific request, you can trace its complete journey and link it to relevant logs for deeper context. If the flame graph reveals a bottleneck - like a slow SQL query or a problematic third-party API call - you can filter traces by duration to isolate P95 or P99 latency spikes. From there, you can drill down into the exact span causing the issue [13]. These insights provide the groundwork for applying AI-driven recommendations to enhance performance further.
Using Insights to Improve Performance
Real-time data capture is just the starting point. AI-powered insights take it a step further, helping you fine-tune your system's performance with precision.
Applying AI Recommendations
Turning bottlenecks into actionable solutions is where the magic happens. Tools like TraceKit use AI to dig deep into why queries or API calls are slowing down. For example, if a database query clocks in at 124ms, the AI analyzes the query structure, table indexes, and recent schema changes. Based on this, it might suggest adding a composite index or rewriting a subquery to streamline performance.
Sofia Burton, Senior Content Marketing Manager at LogicMonitor, explains this shift clearly:
"Traditional monitoring tells you GPUs are maxed out; observability tells you which service is affected and whether it's a model issue, retrieval problem, or capacity limit" [14].
This method ensures that fixes are guided by real production data, not guesswork.
It’s also essential to focus on domain invariants - those core rules your system must always follow. For instance, when optimizing a payment flow, you need to ensure that the rule "balance never goes negative" holds true, even after performance tweaks. By analyzing variable states captured from dynamic logs, AI tools verify that these critical rules remain intact post-optimization.
Validating Fixes and Tracking Improvements
Once you’ve applied a fix, it’s time to measure its impact. Compare traces from before and after the change to confirm latency improvements. Dive into the span structure and timing to ensure the optimization is working as intended.
Keep an eye on tail latencies, like P95 and P99, to catch those pesky edge cases [14]. TraceKit’s anomaly detection can flag outliers automatically, helping you stay ahead of potential issues. Tracking user sessions further allows you to identify and address any lingering slowdowns.
Automated alerts are a game-changer here. Set them up for critical metrics like database query duration, API call latency, and cache hit rates [15]. This way, you can catch regressions early and fix them before they escalate. As Ali Khorsandfard, creator of the Gemvc PHP Framework, shares:
"TraceKit helped me find performance issues before I released the new version of my framework. I was able to fine-tune everything and fix problems before they hit users" [12].
Conclusion
Debugging production latency doesn't have to mean endless redeployments or hours of frustration. With dynamic logs, you gain instant visibility into variable states, stack traces, and request flows, cutting down the time spent reproducing issues or digging through logs.
AI-powered observability tools take it a step further by detecting anomalies, analyzing bottlenecks, and offering specific solutions based on actual production data. They provide detailed traces, precise timing data, and code-level snapshots that make pinpointing latency spikes faster and more effective. This approach paves the way for continuous performance enhancements.
Tools like TraceKit make these insights actionable. Supporting languages like PHP, Node.js, Go, Python, Java, and Ruby, TraceKit lets you capture distributed traces, dive into flame graphs, and monitor database queries - all without needing to redeploy. The outcome? Faster debugging, reduced operational costs, and more time spent building features rather than troubleshooting production issues.
This shift from "logging everything and hoping for the best" to real-time debugging marks a major evolution in tackling production challenges. By combining real-time data collection with AI-driven insights, developers can debug quickly and efficiently, ensuring production stays smooth and stable - without the delays or risks tied to redeployment.
FAQs
What makes dynamic logs different from traditional debugging?
Dynamic logging let you monitor variable states and follow code execution as it happens in a running application - no need to pause, stop, or redeploy the code. This is a game-changer compared to traditional debugging, which often involves halting the program, replicating the issue in a local setup, or tweaking the code just to gather more details.
With dynamic logs, you can dive straight into troubleshooting latency problems right in production environments. This not only saves time but also eliminates the risks tied to redeployment. They’re particularly handy for distributed systems, where recreating issues in a local environment can be a real headache.
How does AI help identify and resolve latency issues in production?
AI is transforming latency debugging by serving as a smart assistant that turns complex data into clear, actionable insights. By analyzing distributed traces, logs, and system metrics, AI helps identify the slowest code paths and pinpoints the best spots for dynamic logs. This eliminates much of the guesswork, saving engineers both time and effort.
AI-powered observability tools take it a step further by spotting abnormal response times and linking them to upstream services. They also generate root-cause hypotheses, giving engineers a clear starting point to address bottlenecks. This means less time spent sifting through endless logs or metrics and more time solving the actual problem.
Tools like TraceKit elevate this process by combining real-time variable state capture with AI-driven insights. It offers performance visualizations like flame graphs and service maps, automatically flags latency issues, and suggests the most effective log point placements. With these AI-powered recommendations, teams can tackle latency challenges quickly and efficiently - no need for redeployment.
How does TraceKit help troubleshoot latency issues in production?
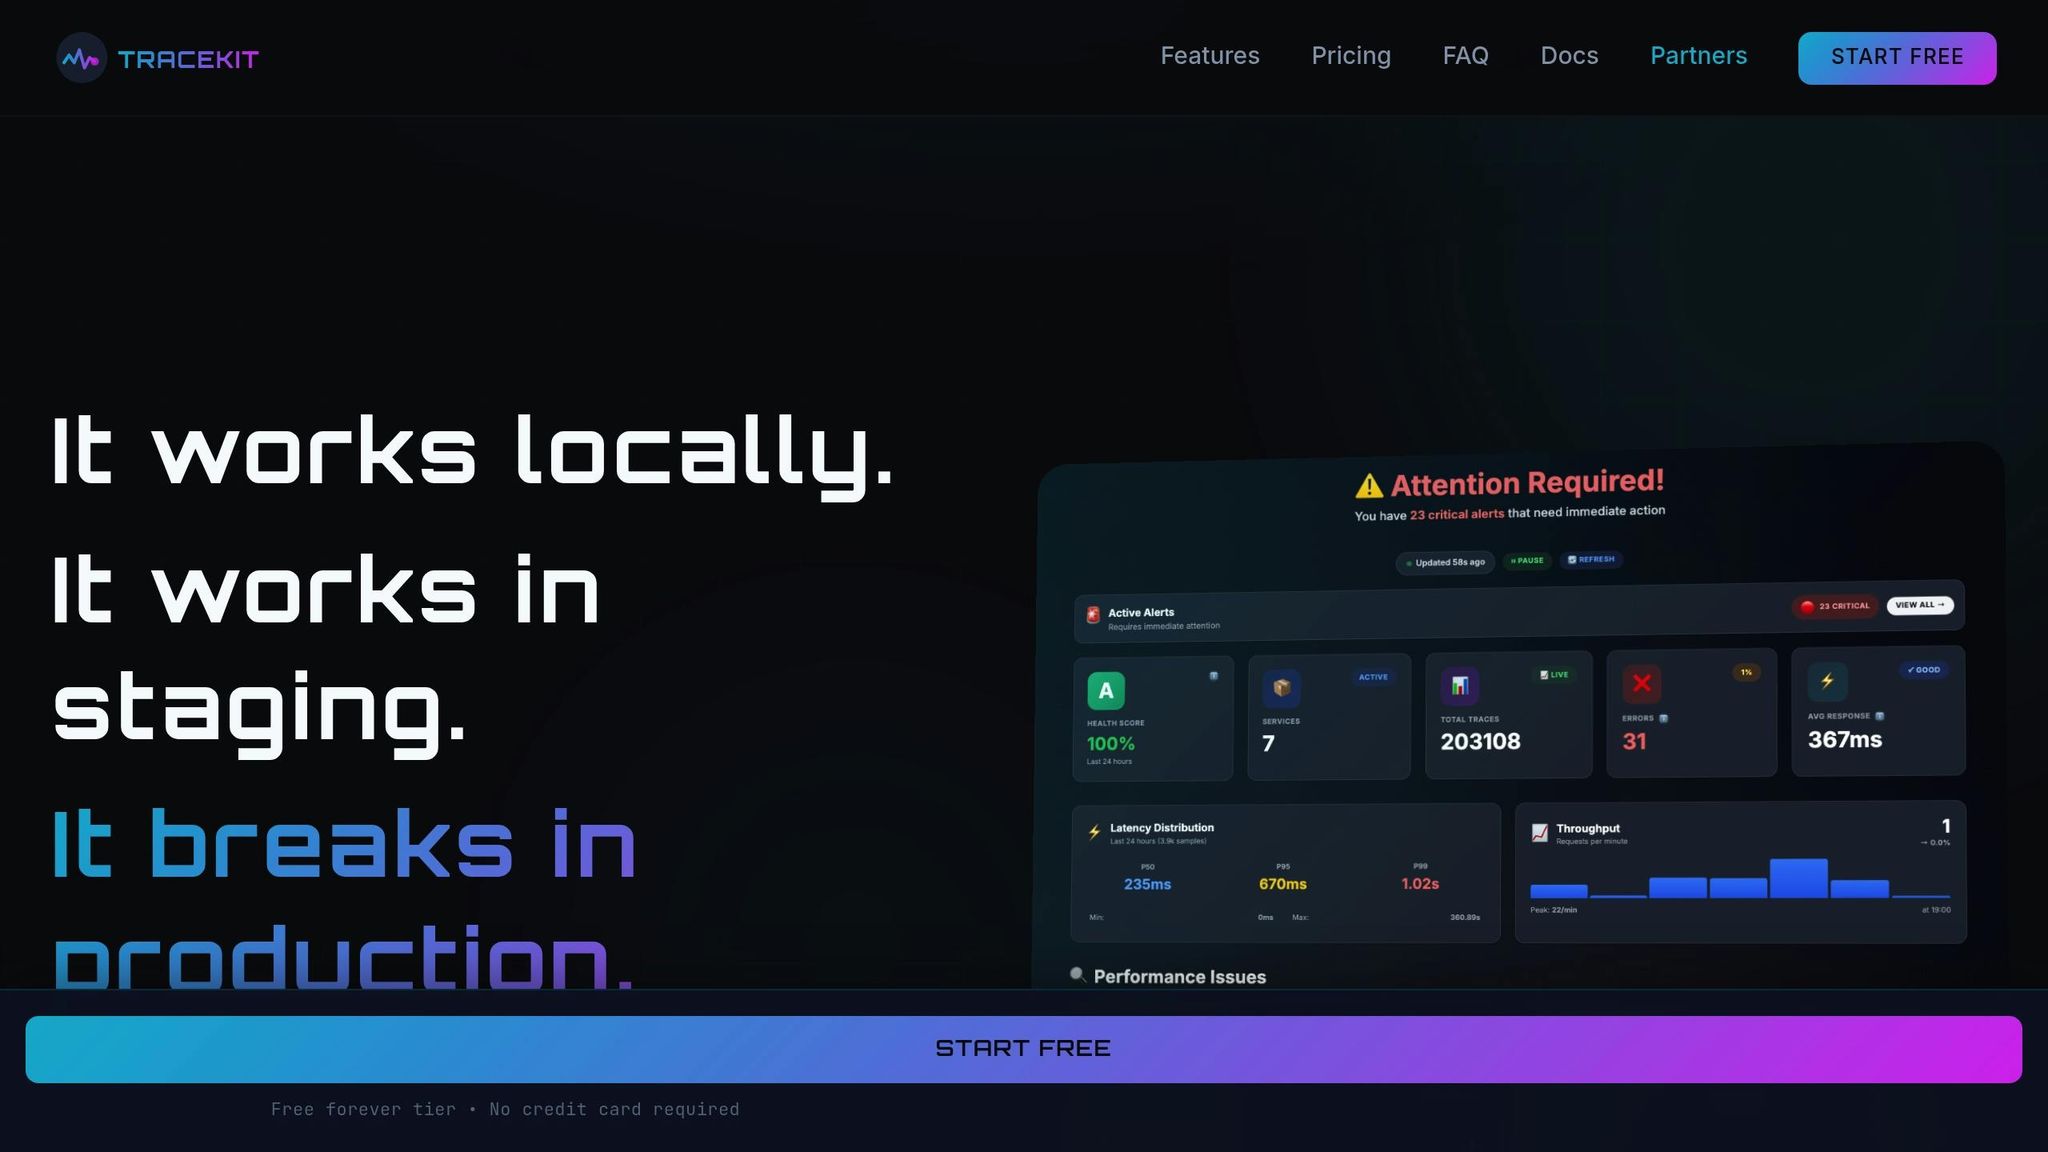
TraceKit makes debugging production latency easier with its dynamic logs and AI-driven observability tools, designed to analyze real-time application behavior. It offers a clear view of the entire request flow, flags latency anomalies, and pinpoints root causes almost instantly.
What sets TraceKit apart is its ability to let you inspect variable states directly in live code - no need to redeploy. You can trace requests across distributed systems and dive deep into performance metrics with tools like flame graphs and service dependency maps. This means you can identify and fix latency problems quickly, keeping disruptions to a minimum.
Related Blog Posts
Related Posts

Laravel Production Debugging: Beyond Logs and Error Tracking
Debug Laravel in production beyond dd() and Log::info(). Use Telescope, dynamic logs, distributed tracing, and performance profiling.

Debug Production Without Redeploying: Step-by-Step Guide
Step-by-step guide to debugging production without redeploying. Set up dynamic logs for PHP, Node.js, Go, and Python in minutes.

Why Your Production Logs Never Have What You Need
Why production logs never have what you need and how to fix it. Replace reactive logging with dynamic logs and tracing to cut debug time by 80%.