Debug production issues 10x faster with distributed tracing. When production breaks, developers traditionally scramble through logs across multiple services, correlate timestamps, and spend hours hunting for root causes. This comprehensive guide shows you how to debug production issues efficiently using distributed tracing—reducing mean time to resolution (MTTR) by 60% and eliminating hours of manual log diving.
Table of Contents
- The Problem: Log Diving is Broken
- The Solution: See the Complete Request Journey
- Real-World Example: Finding a Hidden Bug
- Getting Started with Distributed Tracing
- Key Benefits We’ve Seen
- Common Use Cases
- Frequently Asked Questions
- Next Steps
The Problem: Log Diving is Broken
Traditional debugging relies on logs scattered across multiple services. When something breaks in production, you end up:
- Checking logs in 5 different services
- Correlating timestamps manually
- Guessing which service actually caused the problem
- Spending 2-3 hours per incident
- Still not finding the root cause
This approach doesn’t scale with microservices architectures. When a request flows through 10+ services, manual log correlation becomes impossible.
Why Traditional Debugging Fails
When you need to debug production issues, logs only tell you what happened in one service at one moment. According to incident management best practices, reducing mean time to resolution is critical. But logs don’t show:
- Request flow: Which services were called and in what sequence
- Timing relationships: Whether services ran in parallel or sequentially
- Causation: Which service failure caused downstream errors
- User context: What specific data or user action triggered the issue
- Performance impact: Which operations consumed the most time
Without this context, you’re debugging blind. Distributed tracing solves this by connecting all the dots automatically.
The Solution: See the Complete Request Journey
Distributed tracing automatically tracks every request as it flows through your system. Instead of piecing together logs, you get a complete timeline showing:
- Which services were called and in what order
- How long each step took with sub-millisecond precision
- Where errors occurred with full context
- What data was involved in the request
- User context that triggered the issue
Real-World Example: Finding a Hidden Bug
One of our customers was seeing intermittent 500 errors affecting only 5% of users. When trying to debug production issues, logs showed “database timeout” errors, but the database was running fine.
With distributed tracing, they found the issue in under 5 minutes:
- Clicked on a failed trace
- Saw the API gateway → Auth service → Database path
- Noticed the Auth service was making 20+ database queries per request
- Found an N+1 query bug in the user permissions check
- Fixed the bug, deployed, issue resolved
Time to resolution: 5 minutes (vs. the usual 2-3 hours of log diving)
Getting Started with Distributed Tracing
Modern tracing tools use OpenTelemetry, the industry standard for observability. Here’s how to add tracing to a Node.js API to debug production issues:
// Install the SDK
npm install @tracekit/node

// Add 3 lines to your app
const { TraceKit } = require('@tracekit/node');

TraceKit.init({
  apiKey: process.env.TRACEKIT_KEY,
  serviceName: 'my-api'
});

// That's it! All requests are now traced automatically
No manual instrumentation needed. TraceKit automatically:
- Traces all HTTP requests
- Captures database queries
- Tracks service-to-service calls
- Links errors to traces
- Preserves user context
Key Benefits We’ve Seen
Teams using distributed tracing report:
- 60% reduction in MTTR (Mean Time To Resolution)
- 10x faster debugging for production issues
- Fewer escalations to senior engineers
- Better understanding of system architecture
- Proactive issue detection before users report them
Impact on Development Teams
Distributed tracing transforms how teams work:
Junior developers become autonomous. Instead of escalating every production issue to senior engineers, juniors can trace requests themselves and understand exactly what went wrong. The visual timeline makes complex systems understandable.
On-call becomes less stressful. When you’re paged at 2 AM to debug production issues, distributed tracing shows you the problem immediately. No more panic-searching through logs while users are affected. Most issues can be identified in under 5 minutes.
Cross-team collaboration improves. When debugging involves multiple teams, traces provide a shared view of what happened. No more finger-pointing about whose service caused the issue—the trace shows the facts.
Common Use Cases
1. User-Specific Bugs
“Why does this only fail for some users?” → Click the trace, see their exact session and data that triggered the error. Traces capture the full context including user ID, request parameters, and environment details. This is invaluable for debugging issues that only occur with specific data or edge cases.
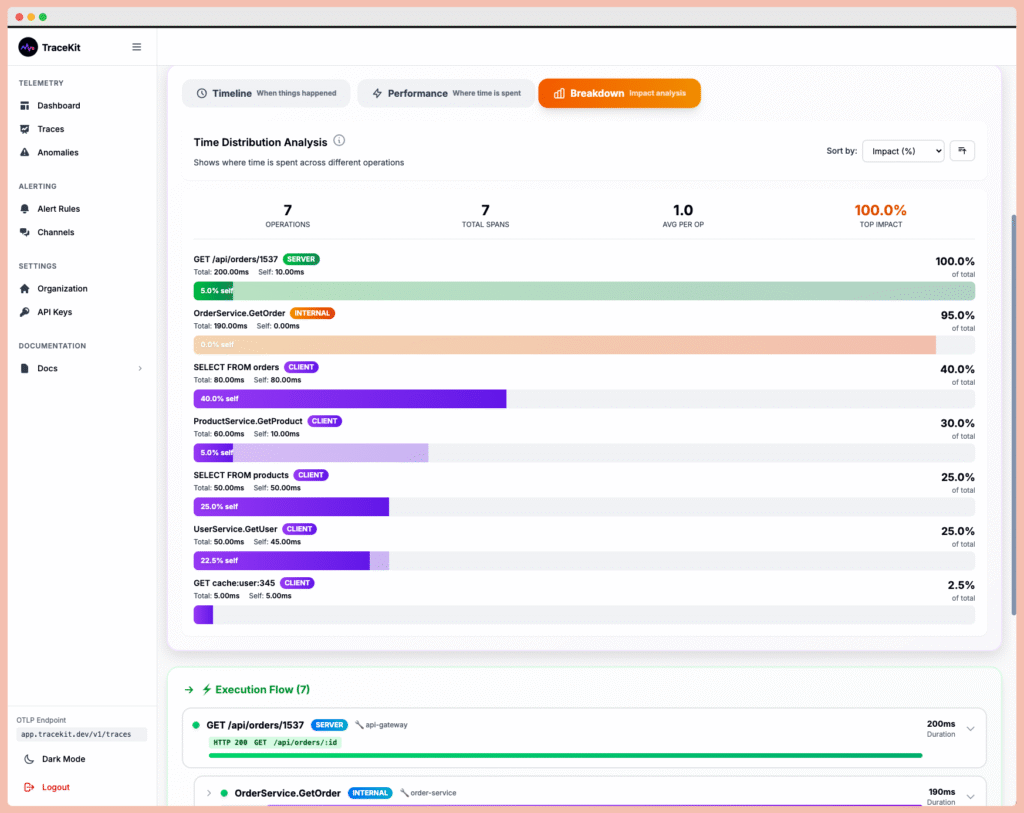
2. Performance Bottlenecks
“Which service is slow?” → Flame graphs instantly show the database query taking 60ms out of a 90ms request. You can drill down to see the exact SQL query, understand which part of your code is calling it, and optimize accordingly. No more guessing about performance problems.
3. Production Incidents
“Production is down!” → See which service failed first and the cascade of errors across your system. During incidents, distributed tracing helps you quickly identify the root cause service and understand how the failure propagated. This speeds up both diagnosis and remediation.
4. Third-Party Integration Issues
When external APIs fail or slow down, traces show you exactly which external service is causing problems, how long requests are taking, and what error responses you’re receiving. This makes vendor conversations much more productive—you have data, not guesses.
Frequently Asked Questions (FAQ)
How do you debug production issues?
To debug production issues effectively, use distributed tracing to track requests across services, capture full context including user data and request parameters, and visualize the complete request journey with flame graphs. This eliminates manual log correlation and reduces debugging time from hours to minutes.
What is distributed tracing?
Distributed tracing is an observability technique that automatically tracks requests as they flow through multiple services in a microservices architecture. It provides a complete timeline showing which services were called, how long each operation took, where errors occurred, and the full context of each request.
How does distributed tracing improve debugging?
Distributed tracing improves debugging by providing immediate visibility into request flows, eliminating manual log correlation, highlighting performance bottlenecks with flame graphs, preserving full context for each error, and reducing mean time to resolution (MTTR) by up to 60%.
What’s the difference between logging and distributed tracing?
Logging captures discrete events in isolation, while distributed tracing tracks the complete journey of requests across multiple services. Tracing automatically correlates related operations, preserves timing information, and provides visual representations. Logs answer “what happened,” while tracing answers “why did it happen.”
Can I use distributed tracing in production?
Yes, distributed tracing is designed for production use. Modern tracing solutions like OpenTelemetry have minimal performance overhead (typically < 1%), use sampling to control data volume, and provide the detailed visibility needed to debug real production issues that can't be reproduced in development environments.
Next Steps
Ready to stop log diving and debug production issues 10x faster?
- Start a free trial and instrument your first service in 5 minutes
- Check the docs for Laravel, Express, Spring Boot, and more
- Try the demo to see real traces in action
Distributed tracing transforms production debugging from hours of guesswork to minutes of certainty. Give it a try!
Questions about distributed tracing? Drop a comment below or start your free trial to see it in action. Check our documentation for framework-specific guides.