5 Ways to Debug Production Apps Without Redeploying
Explore five innovative ways to debug production applications in real-time without redeploying, ensuring smooth user experiences.

Debugging production apps can feel overwhelming, especially when every second counts, and downtime isn’t an option. Thankfully, modern tools enable you to identify and fix issues without redeploying or disrupting your live system. Here’s a quick summary of five effective methods:
- Dynamic Logging: Tools like TraceKit let you inspect running code in real time without halting your app.
- Distributed Tracing: Track requests across microservices to pinpoint where errors occur.
- AI-Powered Anomaly Detection: Automatically monitor for unusual behavior and identify potential problems early.
- Real-Time Log and Metric Collection: Centralize logs and metrics for instant insights into system performance.
- Continuous Profiling: Analyze resource usage live to uncover inefficiencies and improve performance.
These techniques allow you to debug faster and maintain uptime, ensuring a smooth experience for your users.
How to Debug your applications LIVE with Google Cloud Debugger
1. Use TraceKit for Dynamic Logging and AI-Powered Debugging
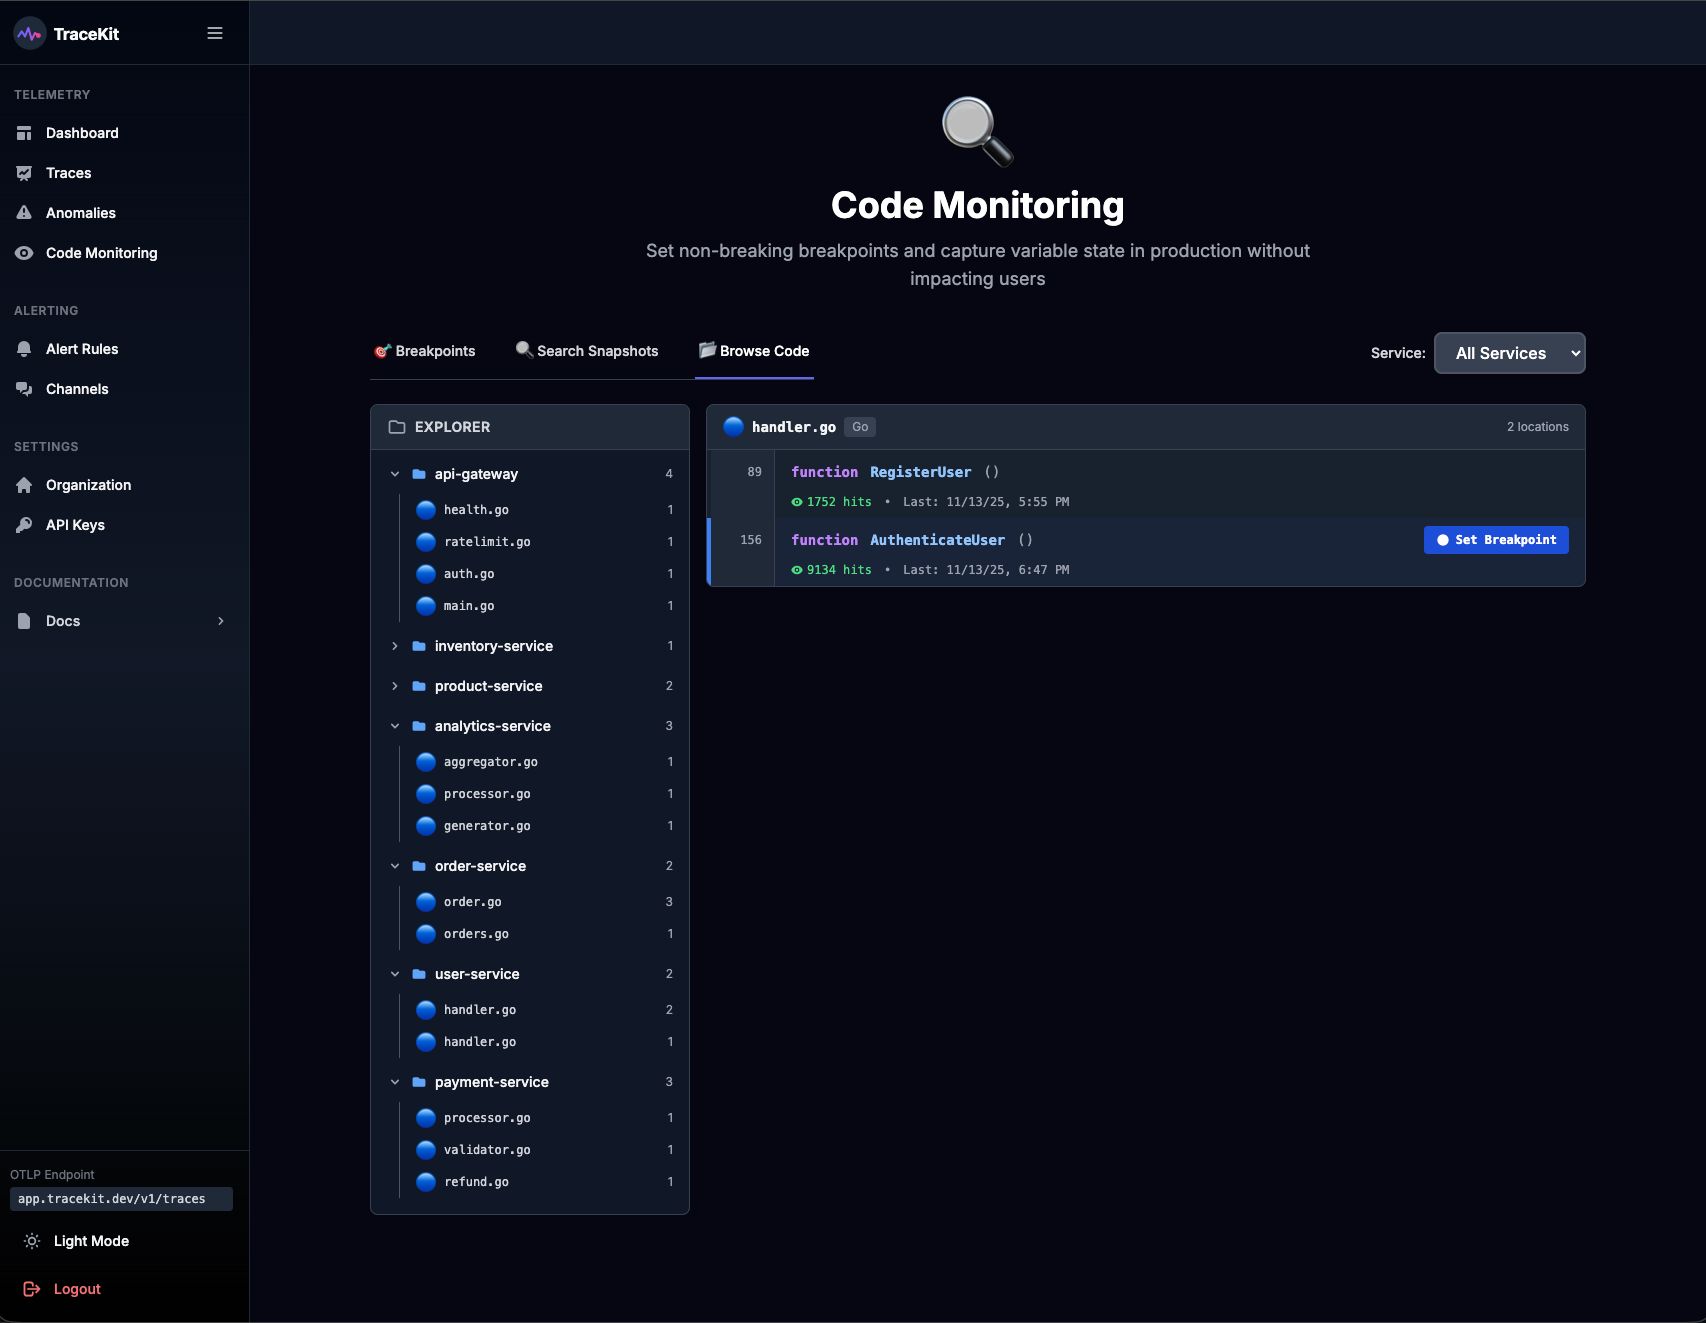
Debugging production apps can be tricky, but tools like TraceKit make it much easier. With TraceKit, you can set dynamic logging to capture real-time execution details - all without pausing your application or deploying extra logging code. This means your app keeps running smoothly for users while you dig into the details behind the scenes.
Here’s how it works: when a dynamic log point is triggered, TraceKit automatically captures a full snapshot of the execution context. This includes everything you need - local variables, parameters, stack traces, and request context - without disrupting the app's functionality. You can inspect critical points in your code without impacting the user experience at all.
What sets TraceKit apart is its built-in AI engine. It analyzes these snapshots to uncover patterns that might point to bugs or performance bottlenecks. For example, if you’re troubleshooting a payment error, the AI might highlight specific variable states that reveal the root cause. This combination of live debugging and AI-driven insights gives you a much clearer view of your system.
TraceKit is versatile, supporting multiple programming languages like PHP, Node.js, Go, Python, Java, and Ruby. It also integrates seamlessly with popular frameworks such as Laravel and Express. Setup is straightforward - just install the TraceKit agent, and you’re ready to start adding dynamic logs with no configuration changes required.
Another standout feature is TraceKit’s trace-to-log correlation. This lets you follow the complete request journey across your distributed system, connecting variable states to the broader context. With this level of visibility, you can pinpoint issues across services without the need to deploy new code, saving time and effort.
2. Set Up Distributed Tracing Across Services
When dealing with multi-microservice applications, things can get messy fast. Services like authentication, payments, inventory, and notifications often interact in ways that make tracking down errors feel like searching for a needle in a haystack. Without a unified view, identifying where things go wrong can be a real challenge.
That’s where distributed tracing comes in. It follows a single request as it weaves through your system. Each time the request moves from one service to another, the tracing system gathers data - timing, errors, and context - creating a detailed map of its journey. This makes it much easier to pinpoint where issues arise.
Here’s how it works: distributed tracing assigns a unique transaction ID to every request. This ID acts like a breadcrumb trail, helping you reconstruct the request’s entire path. By connecting trace data with logs, you can quickly zero in on the source of an error without disrupting your production environment.
The biggest advantage? Complete end-to-end visibility. If a user reports a problem, you can simply look up the transaction ID to see the entire flow of the request. This eliminates guesswork and speeds up debugging, even in the most complex distributed systems.
3. Use AI-Powered Anomaly Detection Tools
Production systems churn out a mountain of data - response times, error rates, memory usage, and more. Keeping tabs on all these metrics manually is next to impossible, and by the time a problem is spotted, it might already be affecting users. That’s where AI-powered anomaly detection steps in to save the day.
These tools analyze historical data to understand what "normal" looks like for your application. They establish baselines for key metrics and then continuously monitor for deviations that could hint at potential issues.
What makes these tools so effective is their ability to catch small changes before they snowball into major problems. Instead of waiting for users to complain or relying on basic alerts, these systems can spot gradual performance dips - like increasing response times or unusual database query patterns - that often indicate deeper issues lurking beneath the surface.
One standout feature is their ability to adapt over time. Unlike static thresholds that need constant tweaking, these tools use advanced models that adjust automatically to account for traffic spikes, seasonal trends, or other routine variations. This means fewer false alarms and more accurate problem detection.
When something unusual is flagged, these tools don't just sound the alarm - they dig deeper. By correlating the anomaly with other events in your system, they help pinpoint the root cause, saving you from endless log digging and guesswork.
The best part? You don’t need to rewrite code or redeploy your application. These tools integrate seamlessly with your existing monitoring systems, learning from the data you’re already collecting. This lets you tackle problems proactively and keep things running smoothly for your users. Up next, discover how real-time log and metric collection can take your monitoring to the next level.
4. Set Up Real-Time Log and Metric Collection
When something goes wrong in production, having instant access to your application's inner workings can mean the difference between quickly fixing an issue or enduring prolonged downtime. Real-time log and metric collection provides a live view of your system's behavior, helping you detect and address problems as soon as they arise.
Centralized logging takes this a step further by pulling data from all your services into one place. Instead of jumping between multiple servers, you get a unified view of your entire stack. This turns debugging into a focused process rather than a frustrating scavenger hunt.
Structured logging adds another layer of efficiency by organizing data into consistent key-value pairs. This makes it much easier to search and analyze compared to unstructured text. For instance, if an error occurs, you can quickly search for specific user IDs, error codes, or request traces without sifting through endless lines of raw logs.
Real-time dashboards complement this by visually tracking key performance metrics like response times, error rates, memory usage, and database performance. If there's a sudden spike in error rates or a drop in performance, you'll see it in seconds - long before it spirals into a bigger issue.
The combination of logs and metrics is a game-changer for reducing resolution time. Imagine spotting a spike in 500 errors on your dashboard at 2:15 PM. With centralized logs, you can immediately filter for that exact timeframe to uncover the error messages and stack traces causing the problem. This link between metrics and logs allows you to pinpoint issues faster than ever.
Modern log aggregation tools also offer real-time alerting based on specific log patterns or performance thresholds. For example, you can set alerts for certain error messages, unexpected drops in log volume, or when performance metrics cross a predefined limit. This proactive approach often lets you catch issues before your users even notice something's wrong.
The best part? Setting this up typically requires no code changes. Most systems can be configured to ship logs and metrics to your chosen platform without needing to redeploy or disrupt your services.
With real-time visibility in place, you're well-prepared to dive into continuous profiling and analyze resource usage more effectively.
5. Use Continuous Profiling for Performance Analysis
Continuous profiling is a powerful addition to real-time log and metric collection, offering a clearer picture of how your application uses resources and where performance can be improved.
This approach involves monitoring resource usage - like CPU, memory, and network bandwidth - while your application is running live. Unlike traditional profiling methods that often rely on manual snapshots and can disrupt operations, continuous profiling collects data seamlessly without affecting live traffic.
One of the standout features of continuous profiling is the use of flame graphs. These visual tools break down resource usage by individual functions or methods, making it much easier to identify bottlenecks. In a flame graph, wider sections represent higher resource consumption, giving you a quick way to pinpoint areas that may need attention.
With tools like TraceKit, flame graphs are automatically generated, allowing you to dive deep - from overall service performance down to specific function calls. This makes potential problem areas in your code much more visible and actionable.
Modern profiling tools use efficient sampling methods to gather data without slowing down your application. By tracking performance patterns over time, you can spot trends during high traffic periods or other moments of inefficiency. This ongoing data collection ensures you're prepared to quickly diagnose and address issues when they arise.
What’s more, profiling data is readily accessible for immediate review. This means you can connect user-reported performance issues with detailed metrics, enabling faster debugging and optimization - all without needing to redeploy your application.
Conclusion
Debugging production applications without the need for redeployment has shifted from being a nice-to-have to an absolute must in today’s fast-moving development landscape. The five methods we've covered - dynamic logging with AI-driven debugging, distributed tracing, AI-powered anomaly detection, real-time log and metric collection, and continuous profiling - equip developers with powerful tools to tackle issues without disrupting the user experience.
What sets these approaches apart is their non-disruptive nature. They allow you to dig into complex problems, pinpoint performance bottlenecks, and uncover root causes - all while keeping your application running smoothly for users. For example, dynamic logging let you capture the exact state of your application during an error, offering invaluable insights. Similarly, distributed tracing simplifies the debugging of microservices by tracking requests across your entire system.
The real-time monitoring capabilities, including log collection and anomaly detection, act as an early warning system. They help you catch and address potential issues before they escalate into downtime or performance problems. On top of that, continuous profiling provides a deeper understanding of resource consumption, helping you identify inefficiencies in your code or services.
Modern debugging tools have made these techniques accessible for teams of all sizes. Features like automatic instrumentation and zero-configuration setups mean even smaller teams can implement advanced debugging solutions without a heavy lift.
By combining these methods, you can create a robust debugging strategy that not only resolves issues faster but also strengthens the overall reliability of your system. Instead of scrambling to replicate problems in a staging environment or risking hasty fixes in production, you can confidently diagnose and resolve issues using real data from your live application.
To get started, pick one or two methods that address your current challenges and gradually expand your toolkit. The effort you invest now will pay off when the next production hiccup becomes a quick fix instead of a prolonged headache. Your team - and your users - will appreciate the difference.
FAQs
What makes dynamic logging with TraceKit different from traditional debugging, and how do they benefit production environments?
Dynamic logging with TraceKit introduces a fresh way to debug by capturing real-time snapshots of your application's state. This includes stack traces and variable values, all without pausing or interrupting the running code. Unlike traditional debugging methods that often require halting the application or redeploying, dynamic logging lets you address issues directly within production environments.
This approach is particularly useful for keeping your application stable. It helps pinpoint root causes quickly, minimizing downtime and disruptions. By offering instant insights into how your code behaves in real-world scenarios, dynamic logging save time, lower risks, and help maintain a smooth user experience.
What are the benefits of using distributed tracing in a microservices architecture, and how does it help identify errors?
Distributed tracing plays a crucial role in microservices architecture by giving developers a clear view of how requests move across different services. This comprehensive insight helps teams understand the interactions between components and identify where problems or delays might be happening.
By following each request through multiple services, teams can quickly zero in on the specific service or operation causing an issue. This approach not only accelerates error detection but also minimizes downtime, keeping your application running smoothly and dependably in production. On top of that, distributed tracing can uncover areas for performance improvements, enabling teams to enhance the system's overall efficiency.
How can AI-powered anomaly detection improve the reliability of production apps, and what types of issues can it detect early?
AI-driven anomaly detection tools play a crucial role in keeping production applications running smoothly by spotting unusual patterns or behaviors as they happen. These tools sift through massive amounts of data to pinpoint deviations from typical operating conditions, giving developers the chance to tackle potential issues before they snowball into bigger problems.
With these tools, teams can uncover problems like performance bottlenecks, unexpected surges in errors, or odd user behavior. Catching these anomalies early means avoiding downtime, fine-tuning app performance, and delivering a seamless experience for users - all without disrupting live operations.
Related Blog Posts
Related Posts

How to Debug Production APIs Without Logs
Debug production APIs without relying on logs. Use distributed tracing, dynamic logging, and AI anomaly detection to find root causes 70% faster.

Laravel Production Debugging: Beyond Logs and Error Tracking
Debug Laravel in production beyond dd() and Log::info(). Use Telescope, dynamic logging, distributed tracing, and performance profiling.

Debug Production Without Redeploying: Step-by-Step Guide
Step-by-step guide to debugging production without redeploying. Set up dynamic logging for PHP, Node.js, Go, and Python in minutes.