Code monitoring revolutionizes how you debug production applications. Instead of stopping your application, redeploying with debug logs, or reproducing issues locally, code monitoring lets you set non-breaking breakpoints in production that capture variable state, stack traces, and request context—all with less than 5ms overhead. This comprehensive guide shows you how to use code monitoring to debug production issues faster, verify calculations, and investigate performance problems without impacting your users.
Table of Contents
- What is Code Monitoring?
- The Problem with Traditional Production Debugging
- How Code Monitoring Works
- Key Features of Code Monitoring
- Code Monitoring in Go
- Code Monitoring in PHP/Laravel
- Code Monitoring in Node.js
- Real-World Use Cases
- Best Practices
- Performance Considerations
- Frequently Asked Questions
- Next Steps
What is Code Monitoring?
Code monitoring is a production debugging technique that allows you to set non-breaking breakpoints in your running application. Unlike traditional debuggers that pause execution, code monitoring breakpoints capture variable state, stack traces, and request context without stopping your application or affecting user experience.
Key Capabilities
- Non-breaking breakpoints – Capture data without stopping execution
- Variable state capture – See all variable values at the exact moment the breakpoint was hit
- Full stack traces – Complete call stack showing how code reached that point
- Request context – HTTP headers, trace IDs, user IDs, and more
- Automatic code discovery – Code is automatically indexed from your traces
- Zero downtime – Debug production without redeploying
The Problem with Traditional Production Debugging
Traditional production debugging has significant limitations:
1. Can’t Reproduce Locally
Many production issues only occur with real data, real traffic, or specific user conditions. Reproducing them locally is often impossible.
2. Debug Logs Are Inefficient
Adding debug logs requires:
- Writing log statements
- Redeploying your application
- Waiting for the issue to occur again
- Searching through logs
- Removing debug logs after fixing
This process can take hours or days.
3. Traditional Debuggers Stop Execution
Using a traditional debugger in production means:
- Stopping the application (affecting all users)
- Connecting to a running process (security risk)
- Stepping through code manually (time-consuming)
- Only seeing one request at a time
4. Missing Context
When debugging production issues, you need:
- What data triggered the issue?
- What was the user’s state?
- What was the request context?
- What were variable values at that exact moment?
Traditional debugging methods don’t capture this context effectively.
How Code Monitoring Works
Code monitoring uses a three-step process:
Step 1: Automatic Code Discovery
Code monitoring automatically indexes your code from traces you’re already sending. When traces contain stack traces (from errors or instrumentation), the system extracts:
- File paths
- Function names
- Line numbers
- Code structure
No extra instrumentation needed! Your existing distributed tracing setup provides all the information.
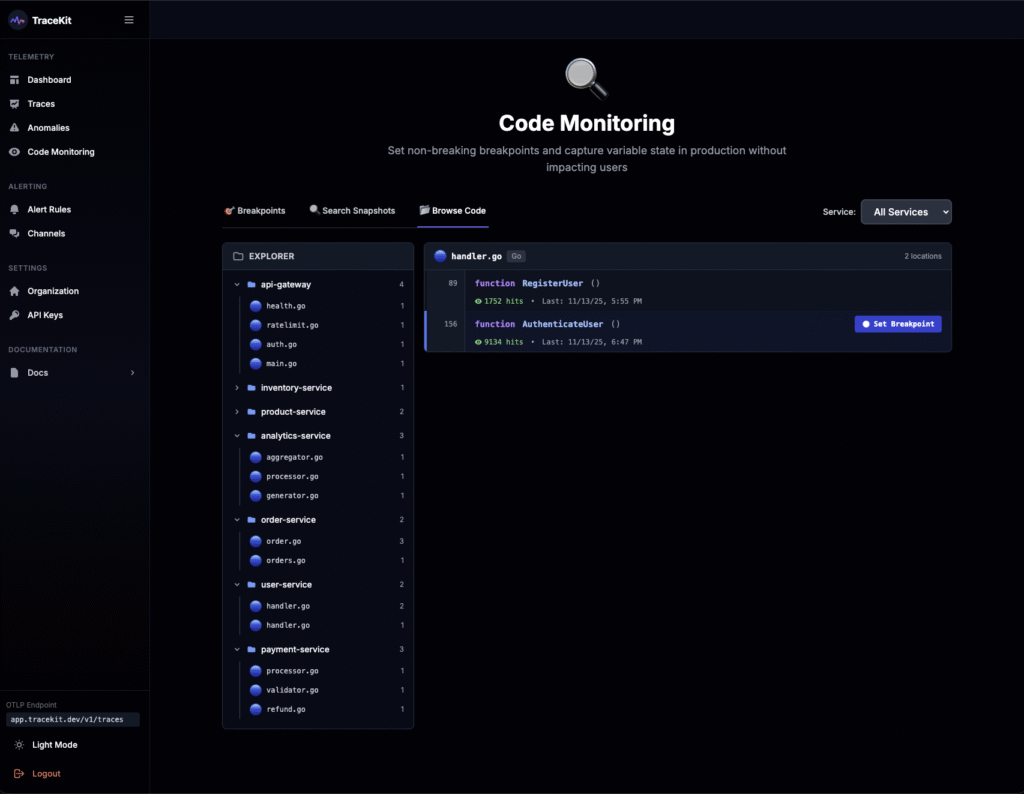
Step 2: Set Breakpoints
Once your code is discovered, you can:
- Browse your code – See all discovered files and functions in the UI
- Set breakpoints – Click on any line of code to set a breakpoint
- Configure conditions – Only capture when specific conditions are met (optional)
- Set sampling rates – Limit captures to avoid performance impact
Step 3: Capture Snapshots
When your code executes and hits a breakpoint:
- Variables are captured – All local variables, function parameters, and return values
- Stack trace is recorded – Complete call stack showing execution path
- Context is preserved – HTTP headers, trace IDs, user IDs, request data
- Application continues – No interruption to user requests
You can then view these snapshots in the UI to understand exactly what happened.
Key Features of Code Monitoring
1. Non-Breaking Breakpoints
Traditional breakpoints pause execution. Code monitoring breakpoints capture data without stopping:
// Traditional debugger: Execution stops here
// Code monitoring: Captures variables and continues

func processPayment(orderID string, amount float64) {
    // Breakpoint set here - captures orderID, amount, and all variables
    // But execution continues immediately
    payment := chargeCard(orderID, amount)
    // ...
}
2. Automatic Breakpoint Registration
Instead of manually creating breakpoints in the UI, you can use automatic registration:
// Automatic file/line detection + auto-creates breakpoint!
sdk.CheckAndCaptureWithContext(ctx, "payment-processing", map[string]interface{}{
    "userID": userID,
    "amount": amount,
    "orderID": orderID,
})

// The SDK automatically:
// 1. Detects file path and line number
// 2. Creates/updates breakpoint in TraceKit
// 3. Captures snapshot when breakpoint is active
3. Variable State Capture
See exactly what values variables had when the breakpoint was hit:
- Function parameters
- Local variables
- Return values
- Struct fields
- Map/slice contents
4. Request Context
Every snapshot includes full request context:
- HTTP method and URL
- Request headers
- Query parameters
- Trace ID (links to distributed trace)
- User ID and session data
- Request body (if applicable)
Code Monitoring in Go
Go is one of the best-supported languages for code monitoring. Here’s how to get started:
Step 1: Install TraceKit Go SDK
go get github.com/Tracekit-Dev/go-sdk/tracekit
Step 2: Initialize SDK with Code Monitoring
package main

import (
    "context"
    "os"

    "github.com/Tracekit-Dev/go-sdk/tracekit"
)

func main() {
    // Initialize SDK with code monitoring enabled
    sdk, err := tracekit.NewSDK(&tracekit.Config{
        APIKey:               os.Getenv("TRACEKIT_API_KEY"),
        ServiceName:          "my-service",
        EnableCodeMonitoring: true,  // Enable code monitoring
    })
    if err != nil {
        log.Fatal(err)
    }
    defer sdk.Shutdown(context.Background())

    // Your application code...
}
Step 3: Add Automatic Breakpoints
The easiest way to use code monitoring is with automatic breakpoint registration:
func processOrder(ctx context.Context, orderID string, userID int) error {
    // Automatic breakpoint registration
    // SDK detects file path and line number automatically
    sdk.CheckAndCaptureWithContext(ctx, "process-order", map[string]interface{}{
        "orderID": orderID,
        "userID":  userID,
        "step":    "starting",
    })

    // Your business logic
    order, err := fetchOrder(orderID)
    if err != nil {
        return err
    }

    // Another checkpoint
    sdk.CheckAndCaptureWithContext(ctx, "validate-order", map[string]interface{}{
        "orderID":    orderID,
        "orderTotal": order.Total,
        "step":       "validation",
    })

    // Process payment
    payment, err := chargePayment(order)
    if err != nil {
        // Capture error state
        sdk.CheckAndCaptureWithContext(ctx, "payment-failed", map[string]interface{}{
            "orderID": orderID,
            "error":   err.Error(),
            "step":    "payment",
        })
        return err
    }

    return nil
}
Step 4: View Snapshots
When your code executes and hits these checkpoints:
- Go to Code Monitoring → Snapshots in the TraceKit UI
- See all captured snapshots with variable values
- Click on any snapshot to see:
- All variable values at that point
- Complete stack trace
- Request context (headers, trace ID, user ID)
- Link to full distributed trace
Real-World Go Example: Debugging Payment Processing
func ProcessPayment(ctx context.Context, orderID string, amount float64) (*Payment, error) {
    // Set checkpoint at payment start
    sdk.CheckAndCaptureWithContext(ctx, "payment-start", map[string]interface{}{
        "orderID": orderID,
        "amount":  amount,
    })

    // Validate amount
    if amount <= 0 {
        sdk.CheckAndCaptureWithContext(ctx, "invalid-amount", map[string]interface{}{
            "orderID": orderID,
            "amount":  amount,
            "error":   "amount must be positive",
        })
        return nil, fmt.Errorf("invalid amount: %f", amount)
    }

    // Fetch payment method
    paymentMethod, err := getPaymentMethod(ctx, orderID)
    if err != nil {
        sdk.CheckAndCaptureWithContext(ctx, "payment-method-error", map[string]interface{}{
            "orderID": orderID,
            "error":   err.Error(),
        })
        return nil, err
    }

    // Charge card
    result, err := chargeCard(ctx, paymentMethod, amount)
    if err != nil {
        // This is where you'd want to debug - what went wrong?
        sdk.CheckAndCaptureWithContext(ctx, "charge-failed", map[string]interface{}{
            "orderID":       orderID,
            "amount":        amount,
            "paymentMethod": paymentMethod.ID,
            "error":         err.Error(),
        })
        return nil, err
    }

    return result, nil
}
When a payment fails in production, you can see:
- Exact amount that failed
- Payment method details
- Error message
- Full request context
- Complete call stack
All without stopping your application or redeploying!
Code Monitoring in PHP/Laravel
PHP and Laravel applications can also use code monitoring. Here's a quick example:
use TraceKit\Laravel\TracekitClient;

public function processOrder(Order $order, TracekitClient $tracekit)
{
    // Set checkpoint
    $tracekit->checkAndCapture('process-order', [
        'order_id' => $order->id,
        'user_id' => $order->user_id,
        'total' => $order->total,
    ]);

    try {
        // Your business logic
        $payment = $this->chargePayment($order);

        $tracekit->checkAndCapture('payment-success', [
            'order_id' => $order->id,
            'payment_id' => $payment->id,
        ]);

        return $payment;
    } catch (\Exception $e) {
        // Capture error state
        $tracekit->checkAndCapture('payment-error', [
            'order_id' => $order->id,
            'error' => $e->getMessage(),
            'stack_trace' => $e->getTraceAsString(),
        ]);

        throw $e;
    }
}
Code Monitoring in Node.js
Node.js applications can use code monitoring similarly:
const { TraceKit } = require('@tracekit/node');

async function processOrder(orderId, userId) {
    // Set checkpoint
    TraceKit.checkAndCapture('process-order', {
        orderId: orderId,
        userId: userId,
        step: 'starting',
    });

    try {
        const order = await fetchOrder(orderId);

        TraceKit.checkAndCapture('order-fetched', {
            orderId: orderId,
            orderTotal: order.total,
            step: 'validation',
        });

        const payment = await chargePayment(order);

        return payment;
    } catch (error) {
        TraceKit.checkAndCapture('order-error', {
            orderId: orderId,
            error: error.message,
            stack: error.stack,
        });

        throw error;
    }
}
Real-World Use Cases
1. Debug Production Issues
Scenario: A customer reports an error, but you can't reproduce it locally.
Solution: Set a breakpoint at the error location. The next time it happens, you'll see:
- Exact user data that triggered it
- Variable values at the moment of failure
- Complete request context
- Call stack showing how code reached that point
2. Verify Calculations
Scenario: You need to verify that financial calculations are correct in production.
func calculateTotal(items []Item, taxRate float64) float64 {
    // Set breakpoint to verify calculation
    sdk.CheckAndCaptureWithContext(ctx, "calculate-total", map[string]interface{}{
        "itemCount": len(items),
        "taxRate":   taxRate,
        "items":     items, // Full item details captured
    })

    subtotal := 0.0
    for _, item := range items {
        subtotal += item.Price * float64(item.Quantity)
    }

    total := subtotal * (1 + taxRate)

    // Capture result
    sdk.CheckAndCaptureWithContext(ctx, "total-calculated", map[string]interface{}{
        "subtotal": subtotal,
        "tax":      subtotal * taxRate,
        "total":    total,
    })

    return total
}
You can now verify calculations are correct by inspecting captured snapshots.
3. Performance Investigation
Scenario: Some requests are slow, but you don't know why.
Solution: Set breakpoints at key operations and capture:
- Input sizes (array lengths, data volumes)
- Timing information
- Which code paths are taken
Compare snapshots from fast vs slow requests to identify patterns.
4. Track Data Flow
Scenario: You need to understand how data flows through complex pipelines.
Solution: Set breakpoints at each stage of the pipeline:
func processPipeline(ctx context.Context, data Data) Result {
    // Stage 1: Validation
    sdk.CheckAndCaptureWithContext(ctx, "stage-validation", map[string]interface{}{
        "data": data,
    })
    validated := validate(data)

    // Stage 2: Transformation
    sdk.CheckAndCaptureWithContext(ctx, "stage-transform", map[string]interface{}{
        "validated": validated,
    })
    transformed := transform(validated)

    // Stage 3: Processing
    sdk.CheckAndCaptureWithContext(ctx, "stage-process", map[string]interface{}{
        "transformed": transformed,
    })
    result := process(transformed)

    return result
}
You can now see exactly how data changes at each stage.
Best Practices
1. Use Descriptive Checkpoint Names
Use clear, descriptive names that indicate what's happening:
// Good
sdk.CheckAndCaptureWithContext(ctx, "payment-processing-started", ...)
sdk.CheckAndCaptureWithContext(ctx, "payment-validation-failed", ...)

// Bad
sdk.CheckAndCaptureWithContext(ctx, "checkpoint1", ...)
sdk.CheckAndCaptureWithContext(ctx, "debug", ...)
2. Include Relevant Context
Capture variables that help you understand the state:
sdk.CheckAndCaptureWithContext(ctx, "order-processing", map[string]interface{}{
    "orderID":    orderID,      // Always include IDs
    "userID":     userID,       // User context
    "orderTotal": order.Total,  // Key business data
    "step":       "validation", // Current step
})
3. Use Conditions for High-Traffic Code
For frequently executed code, use conditions to limit captures:
// Only capture if order total > $1000
if order.Total > 1000 {
    sdk.CheckAndCaptureWithContext(ctx, "high-value-order", map[string]interface{}{
        "orderID": orderID,
        "total":   order.Total,
    })
}
4. Clean Up After Debugging
Once you've fixed the issue, disable or remove breakpoints to avoid unnecessary overhead.
5. Link to Distributed Traces
Code monitoring snapshots automatically link to distributed traces. Use this to see the full request journey.
Performance Considerations
Overhead is Minimal
Code monitoring has less than 5ms overhead per checkpoint when active. When breakpoints are disabled, overhead is near zero.
Use Sampling
For high-traffic endpoints, use sampling:
// Only capture 10% of requests
if rand.Float64() < 0.1 {
    sdk.CheckAndCaptureWithContext(ctx, "high-traffic-endpoint", ...)
}
Set Expiration Times
Configure breakpoints to expire after a set time to avoid leaving them active indefinitely.
Limit Capture Frequency
Use max_captures and capture_frequency settings to limit total captures per breakpoint.
Frequently Asked Questions (FAQ)
What is code monitoring?
Code monitoring is a production debugging technique that allows you to set non-breaking breakpoints in your running application. Unlike traditional debuggers that pause execution, code monitoring breakpoints capture variable state, stack traces, and request context without stopping your application or affecting user experience. It's perfect for debugging production issues that can't be reproduced locally.
How does code monitoring work?
Code monitoring works in three steps: 1) Your code is automatically discovered and indexed from distributed traces you're already sending, 2) You set breakpoints on specific lines of code in the UI or using automatic registration, 3) When code executes and hits a breakpoint, variables, stack traces, and context are captured without stopping execution. You can then view these snapshots to understand exactly what happened.
Does code monitoring slow down my application?
No, code monitoring has minimal overhead—less than 5ms per checkpoint when active. When breakpoints are disabled, overhead is near zero. You can use sampling, expiration times, and capture frequency limits to further reduce impact on high-traffic endpoints.
Can I use code monitoring in production?
Yes, code monitoring is designed for production use. Non-breaking breakpoints don't stop execution, so they don't affect user experience. The low overhead (< 5ms) makes it safe for production environments. You can enable/disable breakpoints without redeploying your application.
What languages support code monitoring?
Code monitoring currently supports Go, PHP, Laravel, and Node.js, with Python and more languages coming soon. The feature works with any language that supports distributed tracing, as code discovery happens automatically from stack traces in your traces.
How is code monitoring different from logging?
Code monitoring captures complete variable state, stack traces, and context automatically at specific code locations without requiring you to write log statements. Logging requires you to manually add log statements, redeploy, wait for issues to occur, then search through logs. Code monitoring lets you set breakpoints instantly and see captured data immediately, without code changes or redeployments.
Do I need to instrument my code for code monitoring?
Code discovery happens automatically from your existing distributed traces—no extra instrumentation needed. However, for automatic breakpoint registration, you can use CheckAndCaptureWithContext() calls in your code, which the SDK uses to automatically detect file paths and line numbers and create breakpoints for you.
Next Steps
Ready to start debugging production without downtime?
- Enable code monitoring in your TraceKit SDK configuration
- Browse your discovered code in the Code Monitoring page
- Set your first breakpoint on a line you want to debug
- Use automatic registration with
CheckAndCaptureWithContext()for easier setup - Try TraceKit - Code monitoring included with distributed tracing
Code monitoring transforms production debugging from days of guesswork to minutes of certainty. Start debugging production issues without stopping your application.
Questions about code monitoring? Start a free trial and see code monitoring in action. Check our language-specific guides for Go, Laravel, and Node.js.