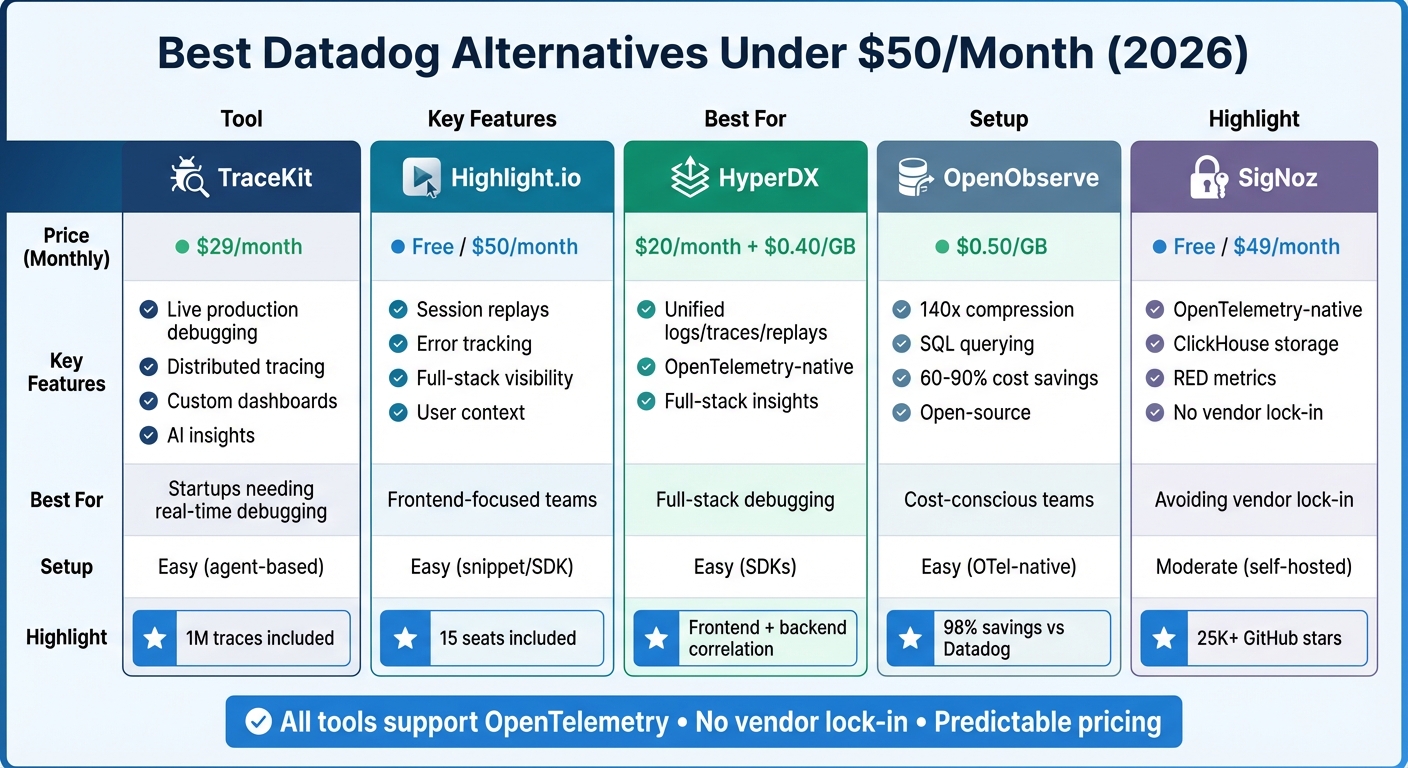
Best Datadog Alternatives Under $50/Month (2026)
5 Datadog alternatives under $50/month for startups. Compare TraceKit, Highlight.io, HyperDX, OpenObserve, and SigNoz on features, pricing, and setup.

If you're a startup or indie developer, Datadog's high costs and complexity can feel overwhelming. Thankfully, there are affordable alternatives under $50/month that deliver essential monitoring and debugging features without breaking the bank. Here's a quick look at five top options:
- TraceKit ($29/month): Runtime inspection and distributed tracing, and custom dashboards. Simple setup and OpenTelemetry support.
- Highlight.io (Free tier available, $50/month for more): Session replays, error tracking, and full-stack visibility. Ideal for frontend-focused teams.
- HyperDX ($20/month + $0.40/GB): Combines logs, traces, and session replays for full-stack insights. Built with OpenTelemetry.
- OpenObserve ($0.50/GB): Open-source or cloud-based with SQL querying and massive cost savings on data storage.
- SigNoz (Free self-hosted or $49/month cloud): Open-source APM with ClickHouse storage. Avoids vendor lock-in with OpenTelemetry-native design.
These tools are designed for small teams, offering predictable pricing, fast setup, and practical features. Whether you need dynamic logs, session tracking, or open-source control, there's a solution here for your needs.
Quick Comparison
| Tool | Pricing | Key Features | Setup Difficulty | Best For | Drawbacks |
|---|---|---|---|---|---|
| TraceKit | $29/month | Dynamic logs, distributed tracing, AI insights | Easy | Startups needing real-time debugging | Limited to 1M traces on Starter plan |
| Highlight.io | Free/$50/month | Session replays, error tracking, user context | Easy | Frontend-focused teams | Limited backend metrics in free tier |
| HyperDX | $20/month + $0.40/GB | Unified logs, traces, and replays | Easy | Teams debugging full-stack issues | Metrics monitoring still in development |
| OpenObserve | $0.50/GB | SQL querying, 140x data compression | Easy (OTel-native) | Cost-conscious teams | Fewer integrations than Datadog |
| SigNoz | Free/$49/month | Open-source, ClickHouse storage, RED metrics | Moderate (self-hosted) | Teams avoiding vendor lock-in | Requires DevOps skills for self-hosting |
These alternatives provide cost-effective ways to monitor and debug your applications without the hefty price tag of enterprise tools like Datadog.
Datadog Alternatives Under $50/Month: Feature and Pricing Comparison
Is this open source observability platform a free Datadog killer?
Why Look for Datadog Alternatives Under $50/Month
Datadog's pricing model can be a tough pill to swallow for small teams. The platform's high-cardinality tax - where tags like container_id can inflate your bill - can account for more than half of your costs. On top of that, you’re charged twice for logs: once for ingestion at $0.10/GB and again at $1.70 per million events for search. Add a per-host fee into the mix, and costs can skyrocket, especially in dynamic Kubernetes environments [8].
This pricing structure often leads to unpredictable bills. For example, one company saw its Datadog invoice balloon to an eye-popping $65 million [8]. On the flip side, businesses that have switched to modern alternatives have reported cutting costs by as much as 60%–98% [3]. Aditya Somani sums it up well:
Datadog's unpredictable and high costs are not just a pricing issue. They are a symptom of an architecture that scales with high-cardinality data by passing significant costs on to the user [8].
Another sticking point is Datadog's reliance on proprietary agents and query languages, which locks users into their ecosystem. This vendor lock-in means teams must rewrite their instrumentation if they decide to switch tools, a time-consuming and frustrating process [3][6]. For small teams focused on shipping features quickly, spending days configuring complex dashboards or learning proprietary DSLs isn't practical [2].
Budget-friendly alternatives address these challenges head-on. By using OpenTelemetry-native instrumentation, they eliminate vendor lock-in entirely. Their usage-based pricing ensures you only pay for what you actually ingest. And with columnar databases like ClickHouse, these tools achieve data compression rates of 14× to 15×, reducing storage costs significantly [8]. Many of these alternatives also include core APM features - like distributed tracing, custom metrics, and unified log views - at a fraction of Datadog's price. Tools like TraceKit even go a step further, offering dynamic logs in production for debugging without redeployment, all for under $50/month [1].
For startups and small teams, these cost-effective options provide the observability they need without the heavy enterprise overhead. It’s no wonder more teams are making the switch.
Comparison Table of Top Alternatives
Here's a quick overview of pricing, features, setup requirements, and key considerations for each observability tool. Each option brings something different to the table, catering to various needs and budgets.
| Tool | Pricing | Key Features | Setup Difficulty | Ideal Users | Primary Drawback |
|---|---|---|---|---|---|
| TraceKit | $29/month (1M traces) | Dynamic logging in production, distributed tracing, custom metrics dashboards, AI-powered anomaly detection | Easy (agent-based) | Startups needing interactive debugging without redeployment | - |
| Highlight.io | Free tier available | Session replays, full-stack visibility, error tracking with user context | Easy (snippet/SDK) | Frontend-focused startups tracking user behavior | - |
| HyperDX | $20/month + $0.40/GB | Frontend session replays correlated with backend logs/traces, OpenTelemetry-native | Easy (SDKs) | Teams debugging full-stack app issues | Metrics and infrastructure monitoring not yet fully developed |
| OpenObserve | Free (open-source) or low-cost cloud | 140x data compression, SQL-based querying, 60-90% cost savings | Easy (OTel-native) | Cost-conscious teams wanting unified observability | Smaller integration marketplace than Datadog |
| SigNoz (Free Tier) | Free tier; paid at $0.30/GB | OpenTelemetry-native, no custom metrics tax, ClickHouse storage | Moderate (self-hosted) | Teams seeking open-source control and avoiding vendor lock-in | Requires DevOps skills for ClickHouse/ |
Highlights of Each Tool
TraceKit is designed for startups needing real-time debugging without the hassle of redeployment. Its standout feature - dynamic logs in production - allows developers to debug production issues faster by inspecting variable states directly in production. For $29/month, the starter plan includes unlimited team members, services, and all features, making it an appealing choice for smaller teams.
Highlight.io focuses on frontend visibility, offering session replays and error tracking with user context. Its free tier and simple setup via a snippet or SDK make it ideal for startups aiming to understand user behavior without breaking the bank.
HyperDX seamlessly ties frontend session replays to backend logs and traces, providing a comprehensive view of app performance. As Michael Shi from HyperDX explains:
HyperDX simplifies instrumenting through batteries-included SDKs, enabling quick setup in just a few lines of code[6].
With pricing starting at $20/month plus additional usage charges, it’s a solid option for teams needing full-stack insights.
OpenObserve prioritizes cost savings and efficiency, boasting features like high data compression and SQL-based querying. Simran Kumari highlights its value:
OpenObserve stands out for teams wanting unified observability with massive cost savings and the flexibility of open source[3].
For teams familiar with SQL and looking to minimize costs, this tool is a strong contender.
SigNoz offers open-source flexibility, allowing teams to avoid vendor lock-in while staying OpenTelemetry-native. It’s particularly appealing for small teams that value control and cost-effectiveness. However, managing infrastructure like ClickHouse and Kafka requires some DevOps expertise, which may be a hurdle for less experienced teams.
Next, we’ll take a closer look at TraceKit and why it’s a standout choice for startups.
1. TraceKit
TraceKit offers dynamic logs with straightforward pricing. For $29/month, the Starter plan includes 1 million traces, 7-day retention, and unlimited team members - no surprise charges for extra hosts or custom metrics.
Pricing (under $50/month)
TraceKit keeps it simple. The Free Forever tier is perfect for students and indie developers with no revenue, providing 200,000 traces per month, 7-day data retention, and essential features like dynamic logs and custom dashboards. The Starter plan, at $29/month, scales up to 1 million traces with the same retention period, handling around 100,000 requests daily.
Besides being budget-friendly, TraceKit is designed for quick and hassle-free setup.
Ease of Setup
You can get started in under 4 minutes: install the CLI, run tracekit init, and let the tool automatically detect your framework, generate API keys, and update your .env file. For example, in November 2025, Terry Osayawe, Co-Founder of TrustyPost, integrated the TraceKit SDK in just 10 minutes. Auto-instrumentation immediately began tracking HTTP calls and database queries without any extra configuration. Sarwar Hossain, a Software Engineer, shared his experience:
Getting started was easy! Signup → API key → 2min Laravel setup → traces flowing. Clear docs, worked immediately.
This effortless setup lets you dive right into TraceKit’s powerful features.
Core Features (APM, tracing, dashboards)
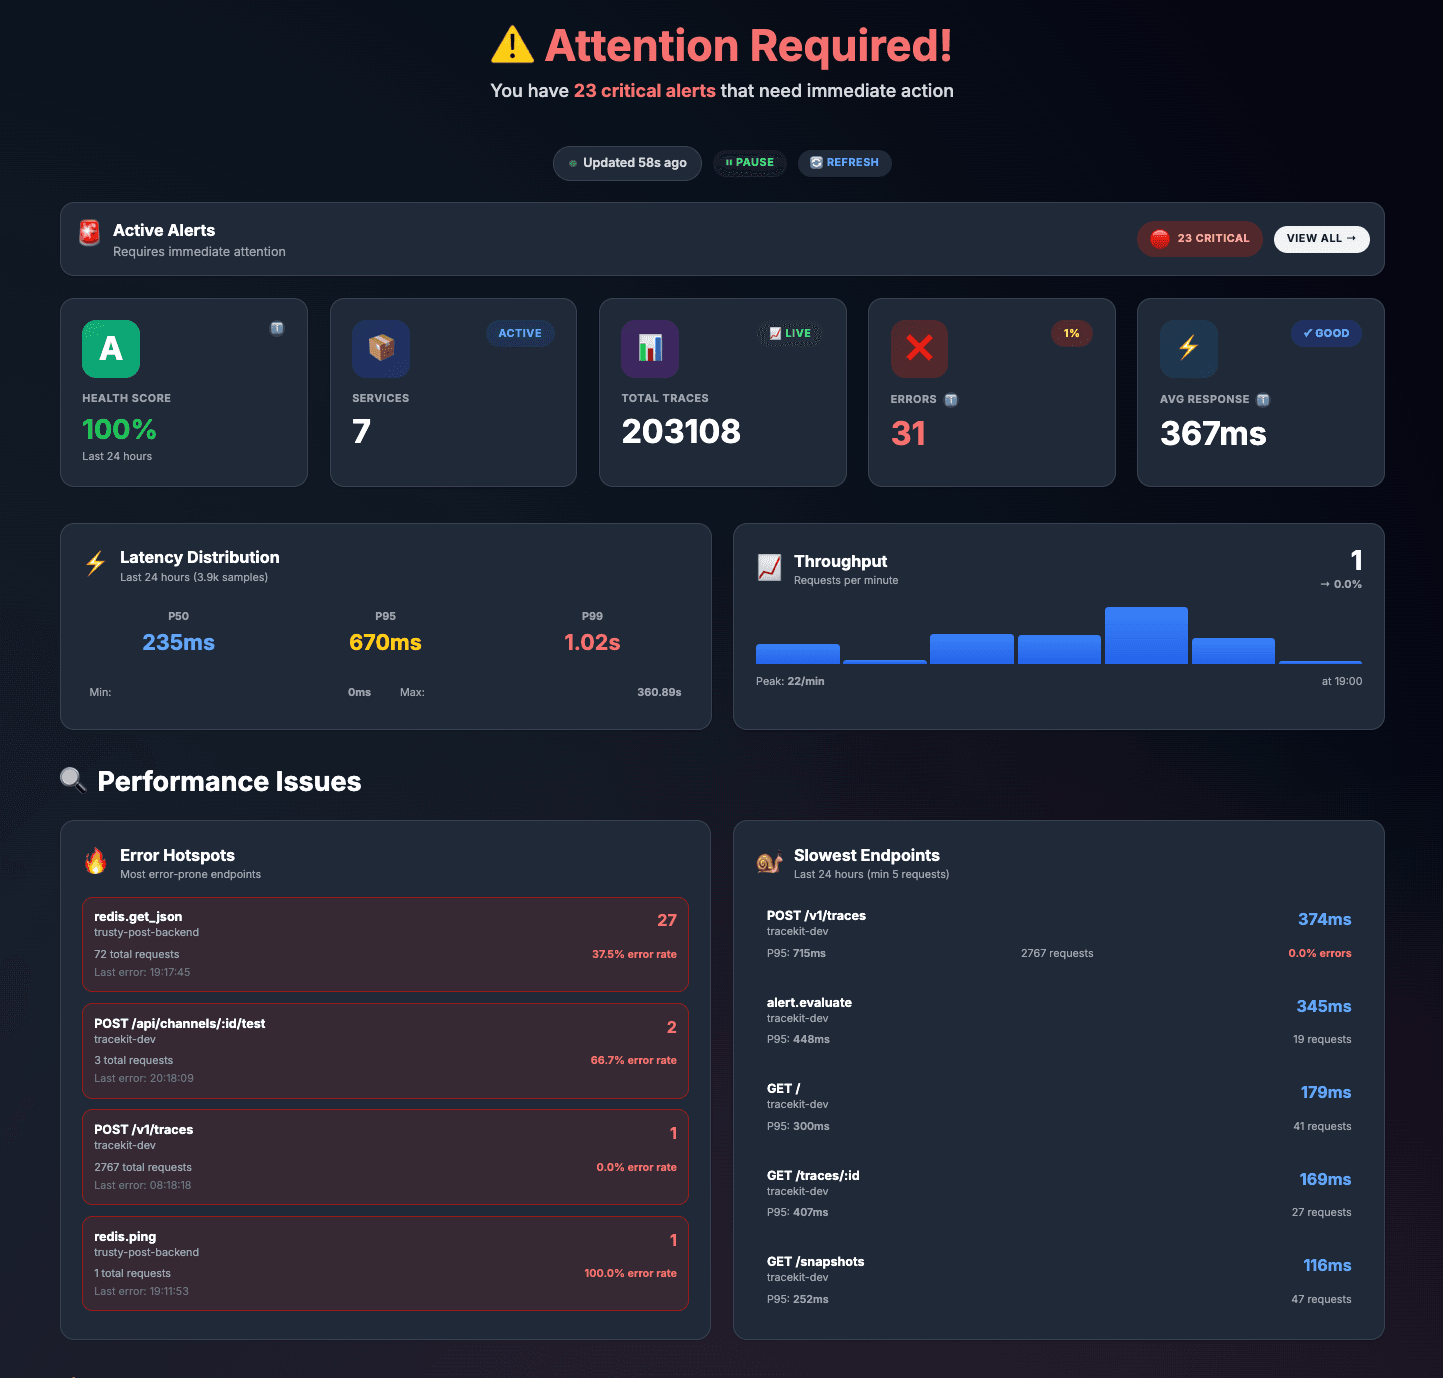
One standout feature is dynamic logs in production. With the SDK, you can set capture points to inspect variable states in real time - no redeploying required. Alex, a solo SaaS founder, used a single capture point to uncover a race condition in an async database write. This resolved a Stripe webhook bug in just 10 minutes, saving him two days of manual logging and redeployment.
TraceKit also excels in distributed tracing, offering flame graphs, service dependency maps, and custom dashboards to monitor P99 latency and error rates - all with under 5% performance overhead in production. Supporting PHP, Node.js, Go observability, Python, Java, and Ruby, TraceKit is built on OpenTelemetry, ensuring you can switch backends without altering your instrumentation code. It’s a modern approach to debugging that avoids vendor lock-in.
Best Fit (e.g., startups, indie hackers)
TraceKit is ideal for solo founders, small teams, and bootstrapped startups looking for real-time debugging without the complexity or cost of enterprise tools. With its simple setup and advanced features, it’s a great choice for developers who can’t justify spending $500+ per month on monitoring. At just $29/month, TraceKit delivers professional-grade observability tailored for side projects and early-stage products.
2. Highlight.io
Highlight.io combines session replay with backend monitoring in one platform, making it a versatile tool for understanding both user behavior and system performance. Its Free Forever plan includes 500 monthly sessions, AI-powered error grouping, and up to 15 seats - perfect for most indie projects looking to get started without upfront costs [5].
Pricing (under $50/month)
For early-stage products, the free tier offers plenty of room to grow. If you need more capacity, the Pay-as-you-go plan starts at $50/month. This plan includes 7-day data retention, support for 2 projects, 3 dashboards, and 15 seats. Additional usage for sessions, errors, logs, and traces is billed separately [5].
Ease of Setup
Highlight.io is designed for simplicity. Thanks to its agent-free architecture, there’s no need to install or maintain server agents [7]. It’s a self-serve platform, so small teams can get started without the complexity of enterprise-level configurations. For those interested in self-hosting, deployment is straightforward with Docker. All it takes are three commands: clone the repository, navigate to the directory, and run the hobby script [10]. Built on OpenTelemetry, Highlight.io ensures flexibility by avoiding vendor lock-in and streamlining instrumentation across your stack [10].
Core Features (APM, tracing, dashboards)
Highlight.io’s session replay stands out, capturing user activity leading up to errors by logging console outputs and network requests [10]. Neil Raina, CTO, highlighted its impact:
Highlight has helped us win over several customers by making it possible for us to provide hands-on support, based on a detailed understanding of what each user was doing [5].
Beyond session replay, the platform offers full-stack error monitoring with custom grouping rules, ClickHouse-powered logging with search and alerts, and distributed tracing for performance insights [10]. Unlike tools that separate frontend and backend monitoring, Highlight.io brings both together in one unified view, giving teams a clearer picture of their application’s performance [7].
Best Fit (e.g., startups, indie hackers)
Highlight.io is ideal for teams building web applications that need insights into both user behavior and backend performance. The free tier’s 15 seats make it accessible for small teams, while the $50/month plan offers predictable pricing as you scale. Meryl Dakin, Founding Software Engineer, shared her experience:
I love Highlight because not only does it help me debug more quickly, but it gives me insight into how customers are actually using our product [5].
With its combination of robust features and affordability, Highlight.io is a strong choice for startups and indie developers looking for a comprehensive monitoring solution.
3. HyperDX
HyperDX brings logs, metrics, traces, and session replays together into a single interface. This integration allows you to seamlessly connect a user's frontend interactions with backend performance, eliminating the need to juggle multiple tools. Built on OpenTelemetry standards, it ensures flexibility and prevents vendor lock-in. Unlike TraceKit's dynamic logs in production, HyperDX zeroes in on creating a unified observability experience by linking frontend actions directly to backend insights.
Pricing (under $50/month)
HyperDX offers a Free tier that includes 3 GB of data per month with a 3-day retention period for one user. It also provides a 14-day trial of Starter features - no credit card required. The Starter plan costs $20/month and includes 50 GB of data with a 30-day retention period and unlimited users. Additional data is charged at $0.40 per GB, with no extra fees for hosts or users. This pricing makes HyperDX significantly more affordable compared to competitors like Datadog, which charges approximately $192/month for 50 GB of data [11].
Ease of Setup
Setting up HyperDX is quick and straightforward. Teams can instrument their entire stack in minutes, thanks to its agent-free installation option. Using just a few lines of code with OpenTelemetry SDKs and native JSON parsing for structured logs, you can get started almost immediately. This efficient setup process ensures you can begin leveraging HyperDX's features without delay.
Core Features (APM, Tracing, Dashboards)
HyperDX uses a ClickHouse-backed search engine to sift through terabytes of data in seconds. Its full-text search capability works for both logs and traces, eliminating the need for complex query languages. Automatic event clustering organizes billions of log events into meaningful patterns, making it easier to spot recurring issues without manual effort. As Michael Shi, author of the HyperDX Blog, explains:
HyperDX, an open-source observability platform, utilizes OpenTelemetry for instrumentation, offering comprehensive insights into stack issues. [6]
A standout feature is session replay, which directly connects frontend recordings with backend traces and logs. This functionality often requires multiple tools in other platforms. Recently, HyperDX was acquired by ClickHouse, reinforcing its commitment to advancing open-source observability.
Best Fit (e.g., Startups, Indie Hackers)
HyperDX is particularly well-suited for agile engineering teams and startups that need to troubleshoot application-level issues spanning frontend and backend, all without a dedicated DevOps team. Its MIT-licensed, self-hostable version is a great option for indie hackers who value data control. With unlimited users and integrations for Slack, Email, PagerDuty, and Intercom, HyperDX provides professional-grade monitoring at a fraction of the cost of enterprise solutions.
4. OpenObserve
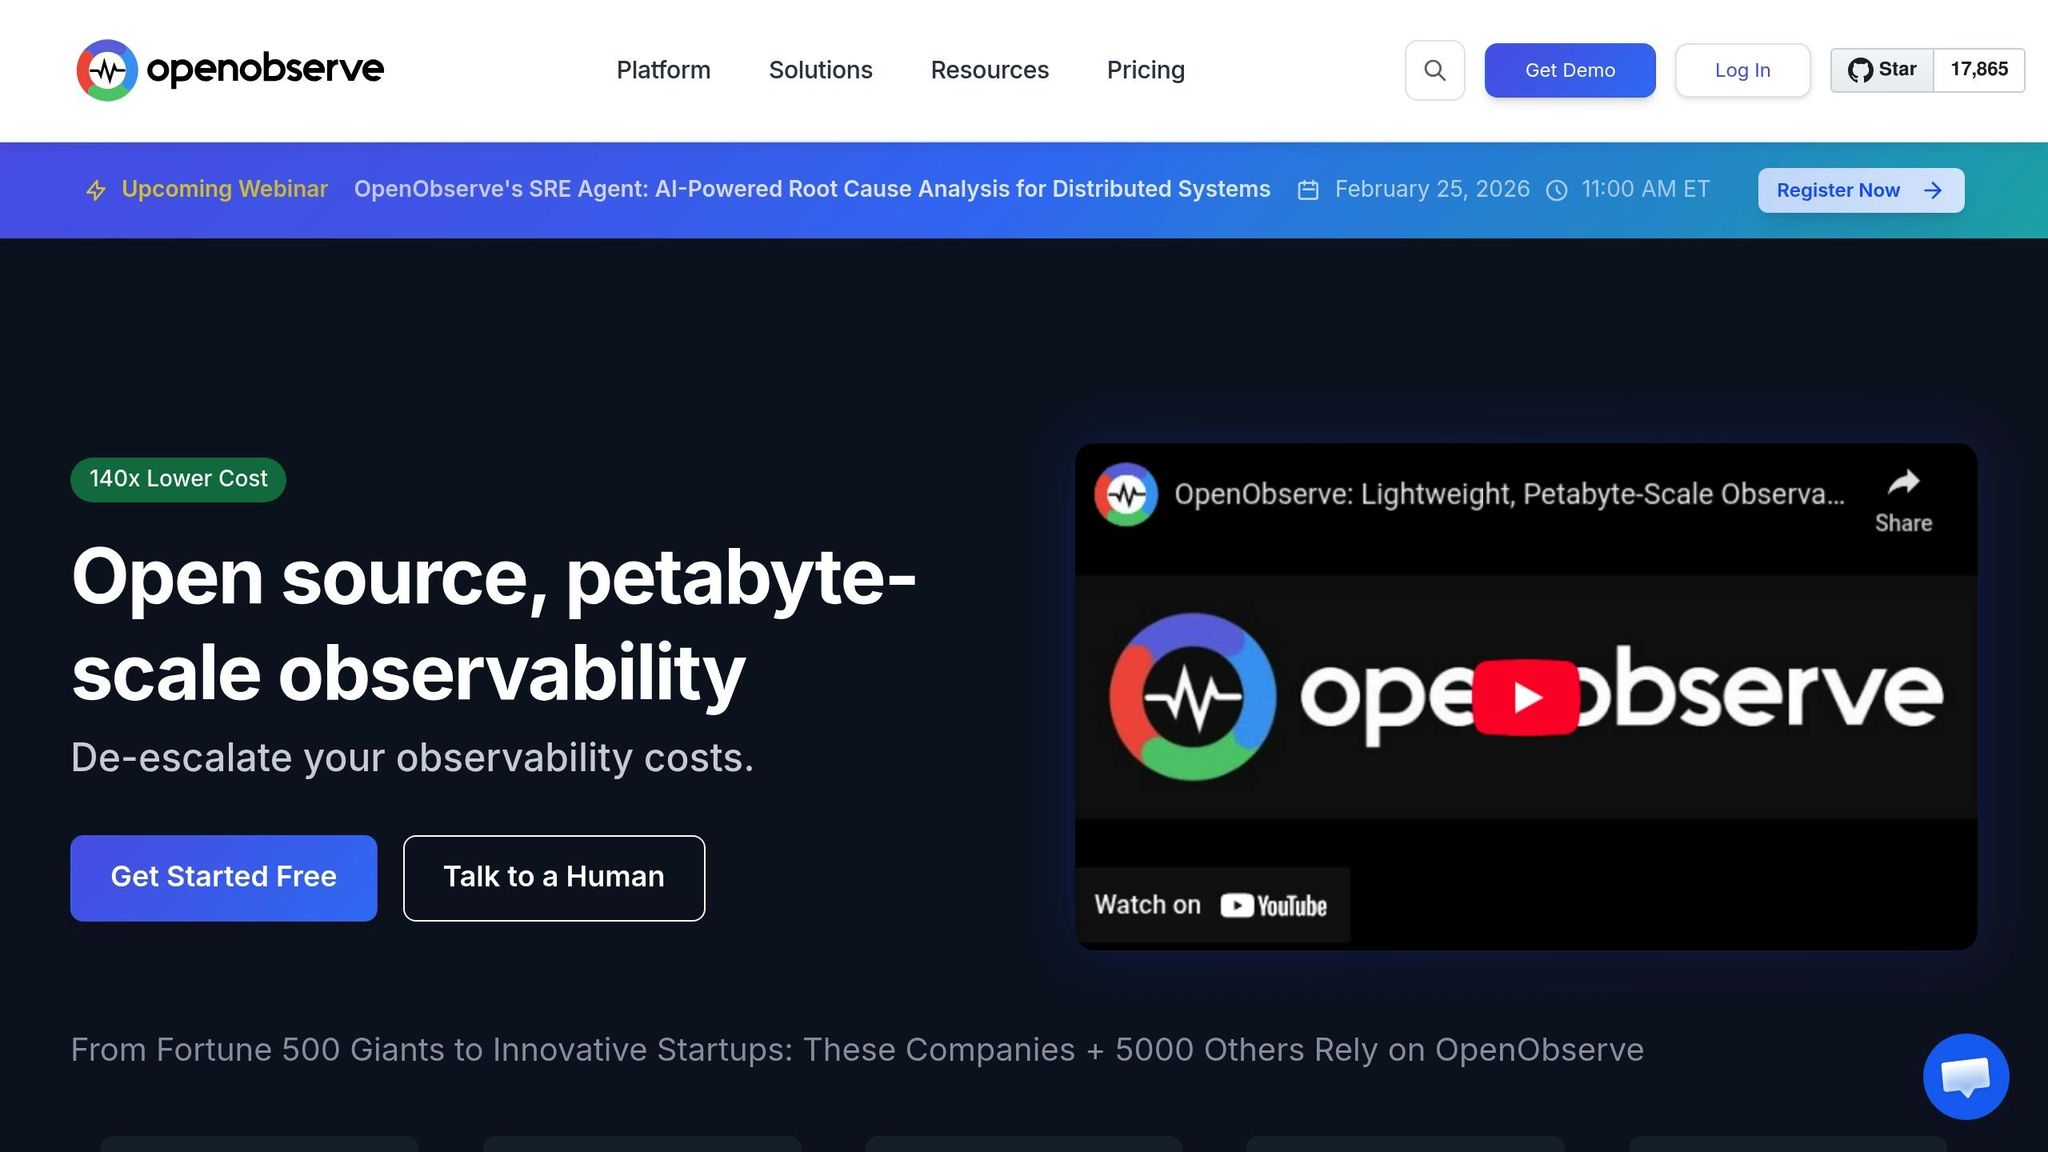
OpenObserve takes a refreshing approach to pricing, focusing solely on data volume. There are no per-host fees or hidden charges - just $0.50 per GB for ingestion, allowing you to handle up to 100 GB of telemetry data monthly[12]. This straightforward, pay-as-you-go model is especially appealing for startups managing distributed systems.
Pricing (under $50/month)
The pricing structure is simple: $0.50 per GB for logs, metrics, and traces, plus $0.01 per GB for queries. Included is a 15-day retention period, with additional storage priced at $0.10 per GB for 30 days. To put this into perspective, in a production test where Datadog charged $174 per day, OpenObserve cost just $3 per day - a 98% savings[13].
In January 2026, Aaron Bell, Principal Systems Engineer at Evereve, transitioned from tools like Datadog, New Relic, and AppSignal to OpenObserve. By consolidating their observability stack and leveraging its 140x compression technology, Evereve reduced 3 TB of audit logs to just 0.5 TB, slashing their observability costs by over 90%[13]. This pricing model not only cuts costs but also simplifies deployment.
Ease of Setup
OpenObserve complements its affordability with an easy setup process. It's designed to integrate seamlessly with OpenTelemetry (OTel), acting as a direct replacement for proprietary agents. By using standard OTel SDKs and routing data through the OpenTelemetry Collector, you avoid vendor lock-in. In fact, Evereve's team had a web UI and API ingesting data from multiple sources in just 15 minutes[13]. For self-hosted deployments, OpenObserve supports Docker and Kubernetes, making it accessible for developers[4][14].
Core Features (APM, Tracing, Dashboards)
OpenObserve provides a unified observability platform that combines logs, metrics, and traces into one interface. It delivers a Datadog-like experience but without the steep enterprise costs. One standout feature is its ability to automatically correlate session replays with backend logs and traces, enabling seamless tracking of requests from the browser to the server. Aaron Bell from Evereve shared his confidence in the platform:
"I don't worry about cost. I don't worry about performance because we really kicked the tires on this - we took it out on the racetrack and ran it around." [13]
Best Fit for Startups and Indie Hackers
OpenObserve focuses on simplicity and affordability, making it a great fit for startups and high-growth teams using Kubernetes. It allows teams to scale their observability needs without costs ballooning as host counts grow. The self-hosted open-source version offers complete control over data residency with no licensing fees, while the cloud version includes a 14-day free trial to evaluate your actual data usage before committing. Additionally, developers familiar with SQL can create advanced alerts without incurring extra per-alert fees, making it a practical choice for teams priced out of traditional enterprise tools.
5. SigNoz (Free Tier)
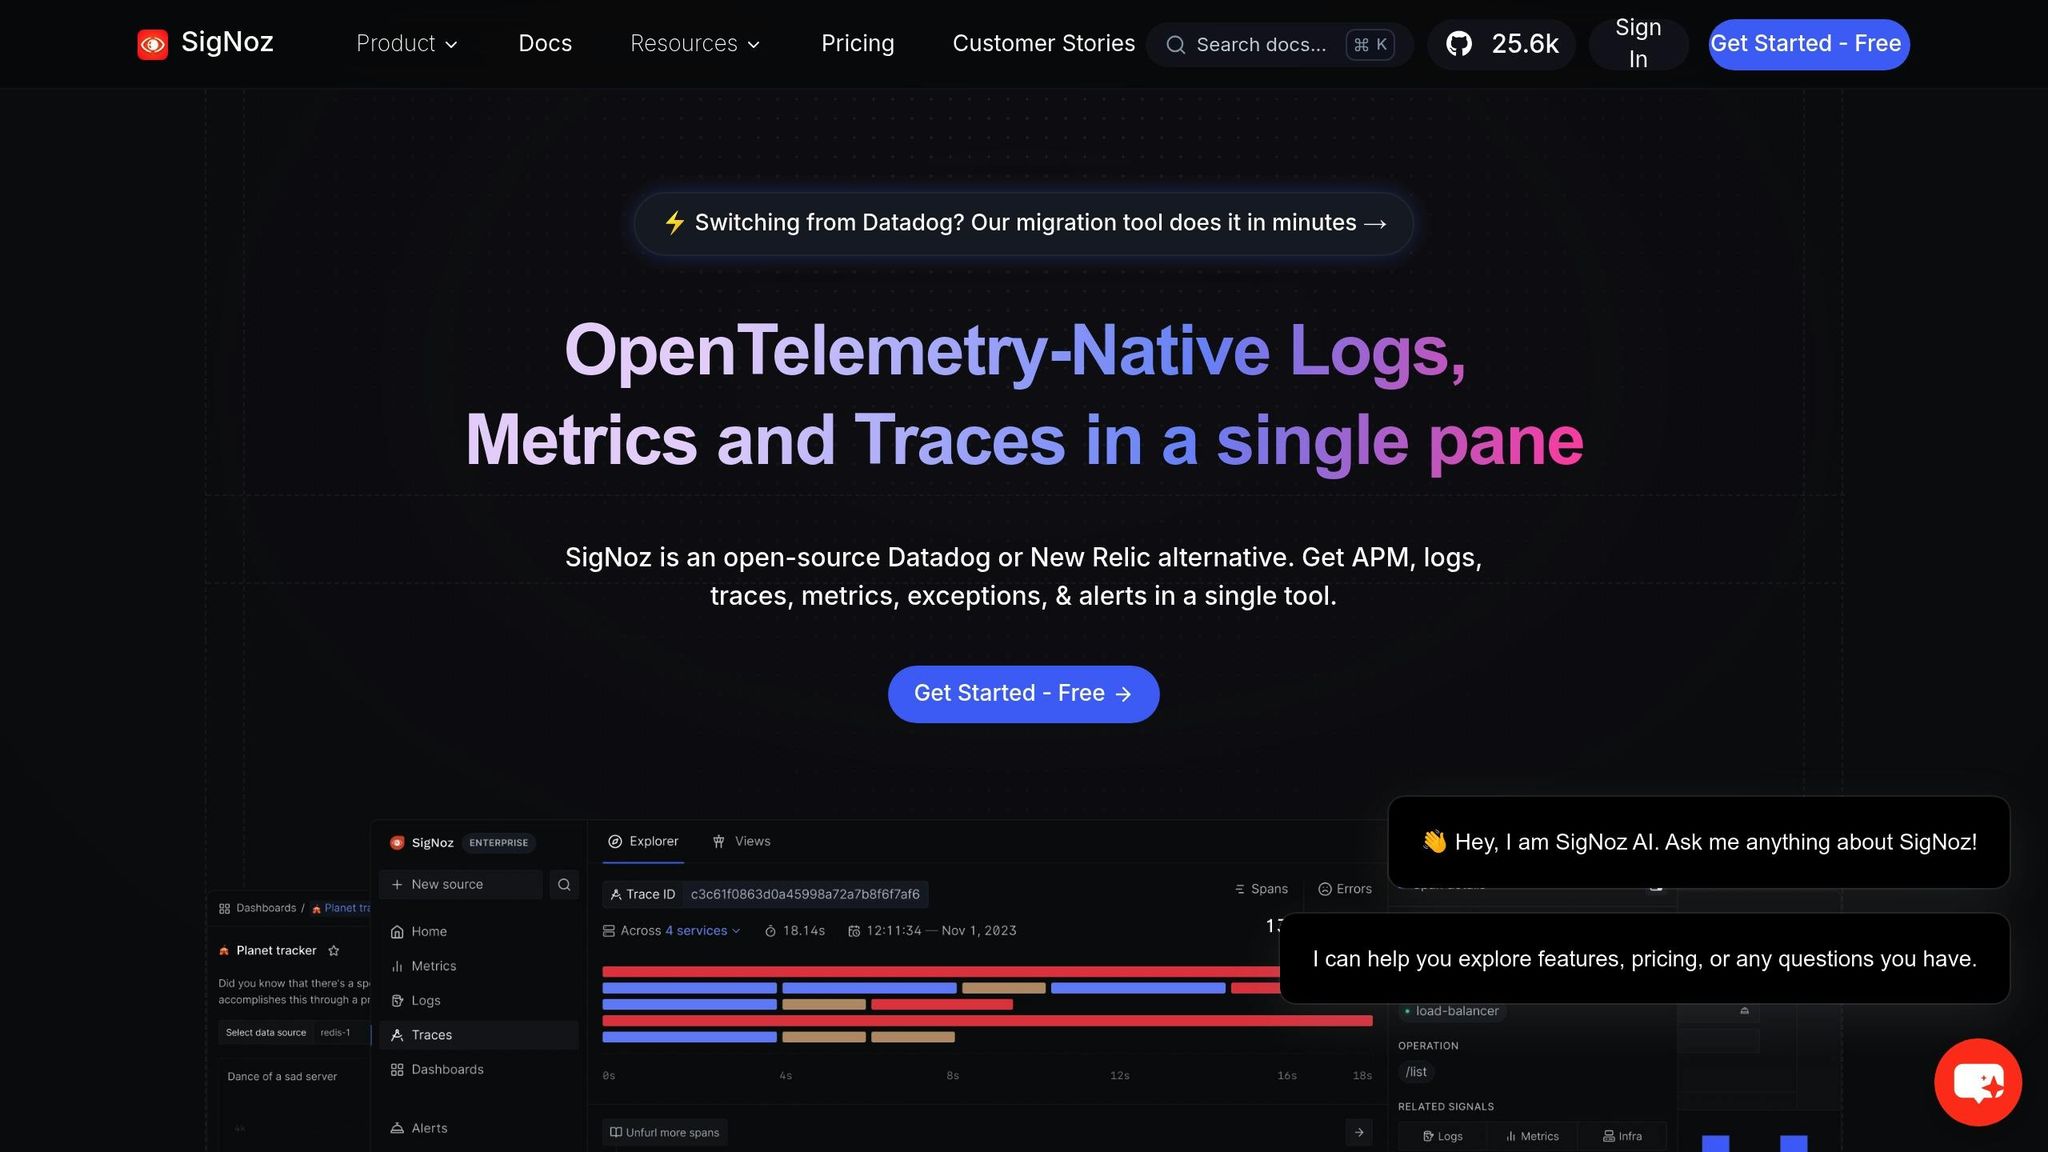
SigNoz provides a free self-hosted Community Edition alongside budget-friendly cloud plans. With over 25,000 stars on GitHub and more than 10 million open-source downloads, it's a favorite among developers seeking application observability without the recurring costs of SaaS platforms [15].
Pricing (under $50/month)
The Community Edition is completely free, licensed under AGPLv3, offering unlimited data retention and ingestion at no cost [28, 30]. For managed services, the Teams cloud plan starts at $49/month, covering approximately 163 GB of logs/traces or 490 million metric samples [16]. Startups meeting specific criteria - less than 3 years old, fewer than 30 employees, and under $6 million in funding - can access the Startup Program at $19/month [18].
SigNoz’s pricing is straightforward and based on data volume: $0.30 per GB for logs and traces and $0.10 per million metric samples [16]. Teams migrating from Datadog have reported up to 80% savings on their observability costs [28, 31].
Ease of Setup
SigNoz makes setup simple, whether you choose the self-hosted option or the cloud service. Sheheryar Sewani, a Rails developer and founder, shared his experience:
Setting up SigNoz was easy - they provide super helpful instructions along with a docker-compose file. [15]
For cloud users, onboarding includes guidance for instrumentation, enabling you to send traces within minutes [19]. As an OpenTelemetry-native platform, SigNoz uses standard OTel SDKs instead of proprietary agents, ensuring you avoid vendor lock-in [17]. An automated migration tool also allows you to transition Datadog dashboards in minutes [28, 31].
Core Features (APM, Tracing, Dashboards)
Once set up, SigNoz offers a comprehensive observability platform that combines APM, distributed tracing, log management, and exception monitoring in a single interface. Key features include RED metrics (Rate, Error, Duration), Apdex scores, service dependency maps, flamegraphs, and Gantt charts for visualizing traces [27, 29]. Powered by ClickHouse as its columnar datastore, the platform handles over 10 TB of daily data ingestion, enabling quick and efficient queries [15].
Apoorva Kumar, Lead Backend Infrastructure Engineer at NuCash, shared their positive experience:
Just deployed SigNoz to an EKS cluster. Still can't believe this is free, everything works like a charm. I am really really impressed with the documentation and dashboard. [15]
This feature set makes SigNoz an appealing and cost-effective option for teams of all sizes.
Best Fit (e.g., startups, indie hackers)
The self-hosted Community Edition is ideal for indie hackers and solo developers with basic DevOps knowledge, offering zero-cost observability. For startups scaling quickly, the $49/month cloud plan eliminates operational overhead while avoiding the steep pricing of platforms like Datadog. SigNoz also includes an "Ingest Guard" feature, allowing you to set daily limits on logs, traces, and metrics to keep costs predictable and under $50/month [28, 31].
With data centers in the US, EU, and India, SigNoz also supports compliance with local data residency requirements, making it a versatile choice for startups and developers [27, 28].
Why TraceKit Works Well for Startups
TraceKit brings a range of features that make it a strong choice for startups tackling production debugging challenges. One standout feature is its dynamic logs, which allow teams to inspect variables in real time - no redeployments or lengthy delays required [1].
Take Alex, for example, a subscription SaaS founder who faced a frustrating Stripe webhook bug in early 2026. This bug sporadically stopped subscription activations, and Alex spent two days adding logs to pinpoint the issue. After switching to a TraceKit capture point, the SDK captured the exact variable state in just 10 minutes. It revealed a race condition caused by an asynchronous database write. With this insight, Alex resolved the bug in a single deploy - a game-changer for small teams where time and resources are tight [1].
At $29 per month, TraceKit is a budget-friendly alternative to enterprise tools. Installation is quick, requiring just one command, and it auto-detects popular frameworks like Laravel, Express, and Django. For instance, fullstack developer Adil Ali integrated TraceKit into a Python Flask app in under 15 minutes. He described it as "much simpler than Datadog for what we need, without feeling stripped down" [1].
Another major benefit is its AI-driven analysis, which simplifies debugging even for junior engineers or founders with limited experience in observability. TraceKit’s unified dashboard consolidates essential tools, offering flame graphs, service dependency maps, and request waterfall visualizations - all in one place. This eliminates the need for separate tools or additional charges for metrics, logs, and traces.
Performance isn’t sacrificed, either. TraceKit adds less than 5% overhead in production, ensuring that enhanced visibility doesn’t slow down your system. For indie developers or small teams priced out of enterprise solutions, the free tier - offering 200,000 traces per month with 7-day retention - provides a no-risk way to try the platform before committing to a paid plan. These features make TraceKit a practical and efficient choice for early-stage teams [1].
Conclusion
Selecting the best APM tool comes down to balancing cost, speed, and the features your team needs. Many enterprise-grade APM tools come with high, often unpredictable costs, which can be a challenge for startups and indie developers.
As outlined earlier, tools like TraceKit, Highlight.io, HyperDX, OpenObserve, and SigNoz provide comprehensive observability for under $50 per month with transparent, usage-based pricing.
- TraceKit: Ideal for dynamic logs without stopping your application and creating custom metrics dashboards.
- Highlight.io and HyperDX: Great options for session-based insights.
- OpenObserve: Perfect for teams needing full control over their data.
These budget-friendly alternatives allow startups and smaller teams to focus on building and innovating without being bogged down by excessive operational costs.
Start with free tiers to test how well the tool integrates with your workflow and meets your needs. Many of these tools let you set up your first service in under 10 minutes, making it easy to evaluate their usability and effectiveness.
Refer back to the comparison table and feature breakdowns to find the tool that best matches your tech stack, budget, and debugging needs. Whether you prioritize dynamic logs, session tracking, self-hosting, or quick deployment, there's an option here to fit your goals.
FAQs
What makes these Datadog alternatives different?
The key differences between these Datadog alternatives boil down to pricing, features, and how user-friendly they are. TraceKit takes the spotlight with its standout feature: dynamic logs in production. This allows teams to debug issues in real time without needing to redeploy. Beyond that, it offers custom metrics dashboards and supports a range of programming languages, including PHP, Node.js, Go, Python, Java, and Ruby - all while being budget-friendly for startups.
Other choices, like OpenObserve and Highlight.io, offer more comprehensive observability tools, such as session replay, error tracking, and frontend monitoring. However, these often come with steeper costs or require more complex setups. For developers or smaller teams prioritizing simplicity and cost-effectiveness, TraceKit delivers a focused, easy-to-use solution with robust debugging capabilities, making it ideal for startups and indie developers.
How do these tools help prevent vendor lock-in?
These tools help teams avoid vendor lock-in by providing open-source or self-hosted options, putting them in full control of their data and infrastructure. Platforms like Uptrace and HyperDX let organizations run their observability stack on their own servers. This approach not only enables easier customization but also simplifies switching providers when needed. Self-hosting eliminates reliance on a single vendor’s SaaS platform.
Many of these tools also embrace open standards like OpenTelemetry. By supporting these standards, they make it easier to integrate with other platforms and streamline migration between solutions. This adaptability allows teams to evolve their observability setup over time, avoiding proprietary limitations while keeping costs manageable.
What’s the best Datadog alternative for teams with little DevOps experience?
If your team doesn't have extensive DevOps experience, Highlight.io could be a great fit. It's an open-source platform that’s easy to navigate, offering features like session replay, error monitoring, and straightforward dashboards. Its user-friendly design and quick setup make it especially appealing for smaller teams or developers who aren't deeply familiar with DevOps.
On the other hand, tools such as HyperDX and OpenObserve pack a lot of power but might require more technical skills - particularly when setting up advanced features like OpenTelemetry. Similarly, TraceKit is a budget-friendly option with robust features like dynamic logs and custom metrics, but it may also demand a bit more technical know-how.
For those prioritizing simplicity and minimal configuration, Highlight.io shines as the most accessible choice for beginners.
Related Blog Posts
Related Posts

TraceKit vs Datadog: Which APM for Small Teams?
TraceKit vs Datadog for small teams: $29/month vs $500+. Compare setup time, features, pricing, and see how one startup saved $46,200/year switching.

New Relic Alternative for Bootstrapped Startups
New Relic alternative for bootstrapped startups. Distributed tracing and dynamic logs starting at $29/month instead of $500+. 5-minute setup.
TraceKit vs Datadog: Same Traces, 80% Less ($29/mo vs $200+)
Cut your Datadog bill by 80%. Real migration story: $4,800 to $950/month with side-by-side feature comparison and step-by-step migration guide.