Application Monitoring vs Observability: Key Differences
Explore the key differences between application monitoring and observability, and learn how they work together to enhance system reliability.

Monitoring and observability are critical for keeping modern software systems running efficiently, but they serve different purposes:
- Application Monitoring: Tracks predefined metrics (like CPU usage, response times, and error rates) to ensure systems are functioning as expected. It's reactive, focused on identifying known issues using alerts and thresholds.
- Observability: Analyzes metrics, logs, and traces to understand system behavior and diagnose unknown problems. It's proactive, helping investigate complex issues in distributed systems.
Key takeaway: Monitoring answers "What happened?" while observability digs into "Why did it happen?" Together, they provide a complete approach to system reliability.
Quick Comparison
| Aspect | Application Monitoring | Observability |
|---|---|---|
| Purpose | Tracks known issues | Investigates unknown problems |
| Approach | Reactive | Proactive |
| Data Sources | Metrics, logs, alerts | Metrics, logs, traces |
| Best For | Simple, stable systems | Complex, distributed systems |
| Setup | Easier | Requires more effort initially |
Both approaches complement each other. Use monitoring for real-time alerts and observability for in-depth analysis, especially in dynamic, distributed environments.
Observability vs Monitoring - Whats the difference?
What is Application Monitoring?
Application monitoring is the process of continuously tracking specific metrics to ensure a system is performing as expected. For decades, this practice has been a cornerstone of IT operations, offering teams the visibility they need to keep systems running smoothly. By defining what "normal" performance looks like and watching for deviations, application monitoring helps maintain system health and align with business goals.
Core Purpose and Data Sources
At its heart, application monitoring focuses on collecting and analyzing metrics that reflect system performance and user experience. These metrics fall into a few key categories:
- Performance metrics: These include response times, throughput (requests per second), CPU usage, memory consumption, and disk I/O.
- Availability metrics: These track uptime, downtime, error rates, and failed requests.
- Business metrics: These connect technical performance to outcomes, such as transaction completion rates or revenue per minute for e-commerce platforms.
The data for these metrics comes from several reliable sources. Application logs capture events and errors, system metrics are gathered through operating system monitoring, and application performance data is collected using code instrumentation or monitoring agents. Once these metrics are defined, monitoring tools step in to detect and respond to deviations.
Reactive Approach
Application monitoring predominantly takes a reactive stance. It identifies issues as they happen, triggering alerts when specific thresholds are breached. This approach is particularly effective for well-known failure patterns and systems with established performance baselines.
For example, if a web server’s CPU usage exceeds 80% for more than five minutes or a database response time surpasses 500 milliseconds, the system generates an alert. Teams can then respond quickly, often following predefined escalation procedures and automated workflows.
This reactive method shines in identifying predictable issues like server crashes, network outages, or resource exhaustion. These problems create clear signals that monitoring systems can detect and report.
However, the reactive nature of this approach has its drawbacks. It struggles to identify unusual or complex problems that don’t fit established patterns. For instance, if an application meets all its technical performance targets but users still face issues due to intricate interactions between services, traditional monitoring might miss the root cause entirely.
Common Use Cases
Application monitoring delivers valuable insights across a range of operational scenarios:
- SLA monitoring: Organizations use monitoring to prove they’re meeting contractual obligations for uptime and performance.
- Infrastructure monitoring: This involves tracking server health, network performance, and storage utilization. These systems often have predictable failure modes, making them ideal for traditional monitoring tools.
- Capacity planning and cost management: Historical data from monitoring helps teams make informed decisions about scaling resources, meeting regulatory requirements, and managing cloud spending.
Monitoring is particularly effective in stable environments with predictable workloads. Legacy systems, for instance, often benefit from this straightforward approach. When you have a clear understanding of what "normal" looks like and can anticipate potential problems, application monitoring becomes an efficient tool for maintaining system reliability.
What is Observability?
Monitoring focuses on tracking predefined signals, but observability goes further - it uncovers unexpected issues and provides a deeper understanding of a system's internal workings. Observability marks a shift from traditional monitoring by analyzing external outputs to deduce the internal state of complex systems. This approach allows teams to uncover hidden problems and address unforeseen questions.
The idea comes from control theory, where a system is considered observable if its internal state can be inferred from external behaviors. In software, this means gaining insight into application performance through three main data types: metrics, logs, and traces. Together, these data sources offer a detailed view of how systems function in real-world scenarios.
Unlike monitoring, which relies on predefined thresholds and alerts, observability emphasizes exploration and discovery. It’s especially relevant in modern distributed systems, where intricate service interactions can cause unpredictable behaviors that traditional monitoring might miss. Observability not only complements monitoring but also fills in the gaps left by older methods, making it indispensable for analyzing and optimizing complex systems.
Exploratory Nature
Observability shifts the focus from reactive monitoring to proactive investigation. Instead of waiting for alerts, engineers can explore system behaviors, detect anomalies, and identify trends before they impact users.
This capability is particularly valuable in microservices and cloud-native environments. For example, when a single request travels through dozens of interconnected services - each with its own dependencies - observability tools can trace the entire path. Teams can use this information to spot response time issues, locate bottlenecks in specific parts of the code, and understand how performance problems ripple through the system.
While monitoring asks, "Is the system healthy?" observability digs deeper: "Why is the system behaving this way?" This approach allows for ongoing performance improvements rather than just maintaining a baseline. Modern observability platforms also support on-the-fly queries, enabling engineers to filter data by user groups, regions, or feature flags, making it easier to address complex problems that don’t fit into predefined monitoring rules.
Root Cause Analysis
One of observability’s strengths is its ability to provide detailed diagnostics that go beyond identifying surface-level issues. When something goes wrong, observability tools help teams uncover not just what happened, but also the sequence of events that led to the problem. This clarity speeds up resolution and helps prevent future incidents.
For example, during an incident, teams can trace requests across the entire architecture to pinpoint where delays occurred, identify slow database queries, and track how errors spread between services. This approach is particularly effective for resolving intermittent problems that traditional monitoring might miss. By correlating historical data and events across components, observability tools can uncover sporadic issues or those affecting only specific user groups. They also help connect technical glitches to broader user experience concerns and overall business outcomes.
Advanced Techniques
Modern observability relies on advanced methods to deliver deeper insights into system behavior. Distributed tracing, for instance, maps the flow of requests across services. Each trace captures timing, error details, and metadata for every interaction, making it easier to identify performance bottlenecks.
AI-powered anomaly detection takes things further by learning normal patterns and flagging subtle deviations. Unlike static thresholds, these systems adapt to seasonal trends, traffic fluctuations, and system changes, reducing false alarms while catching issues that might otherwise go unnoticed.
Real-time correlation engines are another key innovation. They analyze relationships between system components and user behaviors, identifying shared causes behind seemingly unrelated events. Contextual debugging also enhances traditional logging by capturing the full state of the application at the time of an issue - this includes variable values, stack traces, and environmental details. Such rich context simplifies reproducing and fixing bugs in production.
Key Differences Between Application Monitoring and Observability
Both monitoring and observability aim to keep systems running smoothly, but they tackle this goal in distinct ways. Knowing these differences can help teams choose the right strategy based on their system's complexity and specific needs.
At its core, the difference lies in how they operate and what they focus on. Think of monitoring as a security camera - it keeps an eye on specific areas and alerts you when something crosses a set boundary. Observability, on the other hand, is more like a diagnostic toolbox - it helps you dig deeper to uncover the reasons behind unexpected system behaviors.
Timing is another key distinction. Monitoring reacts to issues after predefined metrics detect a problem. Observability, however, allows for proactive exploration, enabling engineers to investigate system behavior even when no issues are immediately apparent.
Their data usage also sets them apart. Monitoring relies on structured, predefined metrics to answer specific questions about system health. Observability goes further by incorporating both structured and unstructured data, making it possible to explore unexpected patterns and ask open-ended questions.
Comparison Table
| Aspect | Application Monitoring | Observability |
|---|---|---|
| Primary Purpose | Track known issues and system health | Understand system behavior and uncover unknown problems |
| Approach | Reactive - responds to alerts | Proactive - enables investigation and exploration |
| Data Sources | Predefined metrics, logs, and alerts | Metrics, logs, traces, and contextual data |
| Question Type | "Is the system working?" | "Why is the system behaving this way?" |
| Complexity | Simple thresholds and dashboards | Advanced tools for correlation and analysis |
| Best For | Stable, predictable systems | Complex, distributed architectures |
| Setup/Maintenance | Easier to set up and maintain | More effort initially, but deeper insights long-term |
| Cost | Typically lower | Often higher due to advanced tooling |
How They Work Together
Rather than being opposing strategies, monitoring and observability complement each other in modern DevOps workflows. Monitoring offers quick alerts for immediate issues, while observability digs deeper to uncover the root cause when those alerts don’t provide enough information.
Observability steps in where monitoring stops. For instance, when monitoring tools flag an issue but don’t explain the cause, observability tools allow engineers to trace the problem through the system’s intricate layers.
Many engineering teams succeed by adopting a layered approach. They use monitoring for real-time alerts and system health checks, then turn to observability tools for in-depth investigations when issues persist or when optimizing performance. This blend ensures thorough coverage without adding unnecessary complexity for simpler problems.
This combination is especially valuable in incident management workflows. Monitoring tools can trigger observability tools automatically, capturing detailed system data the moment an issue arises. This seamless transition reduces diagnosis time, helping teams resolve problems faster and gain a better understanding of their systems.
For organizations scaling their applications, this dual strategy offers room to grow. Teams can start with basic monitoring for immediate needs and gradually integrate observability as their systems grow more complex and their troubleshooting demands evolve.
Next, we’ll look at how TraceKit uses this combined approach to deliver AI-powered observability.
When to Use Application Monitoring vs Observability
Choosing between application monitoring and observability depends on your system's complexity, how predictable its failures are, and the resources you have available. Here's a closer look at when each approach works best.
Application Monitoring for Simple Systems
Monitoring shines when you're working with straightforward systems that behave predictably. If your application follows established patterns and most issues can be anticipated, monitoring is an efficient and budget-friendly choice.
Monolithic applications are a great fit for a monitoring-focused strategy. These systems typically have well-defined boundaries, consistent resource usage, and easily identifiable failure points. For instance, if your app runs on a single server or a small, stable cluster, setting up alerts for unusual resource usage or response time spikes can tackle most problems effectively.
For small teams with limited resources, monitoring is especially practical. It’s quick to set up, and the dashboards are easy to understand, making it an ideal starting point.
Observability for Complex, Dynamic Systems
When dealing with distributed systems, observability becomes essential. These setups often involve multiple containers, microservices, or even cloud regions, making it critical to understand how user requests flow through the system for effective troubleshooting.
Cloud-native applications are a prime example. They often use serverless functions, auto-scaling groups, and dynamic service discovery, all of which can introduce unpredictable failure modes that traditional monitoring might miss. Since cloud resources are often short-lived, issues can disappear before alerts even trigger.
Rapidly changing codebases are another scenario where observability proves invaluable. With frequent deployments, system behavior can shift constantly, introducing new interactions or performance quirks. Observability tools help teams spot these evolving patterns and uncover unexpected issues.
High-traffic applications with complex user journeys also benefit from observability. When systems handle many simultaneous users taking varied paths, traditional monitoring metrics can lose relevance. Observability allows teams to trace individual user sessions and identify bottlenecks that might only affect specific groups of users.
Using Both Approaches Together
The best results often come from combining monitoring and observability. Monitoring is great for catching routine issues, while observability provides deeper insights when problems require more detailed investigation.
A practical approach is to start with monitoring to establish performance baselines. Then, layer in observability tools as needed - either gradually or through trigger-based data collection. For example, monitoring tools might detect an anomaly, like a spike in response times, and automatically activate detailed tracing for requests during that period. This method provides rich context for analysis without the overhead of constant, detailed logging.
Different teams can also use these approaches in complementary ways. Operations teams might focus on monitoring dashboards to track day-to-day system health, while development teams dive into observability tools for debugging and fine-tuning performance.
As your system evolves, so should your strategy. Applications that begin as simple, predictable setups can grow into complex ecosystems. Teams relying solely on monitoring may eventually need the deeper insights observability offers. Planning for this shift early can save time and effort as your system scales.
How TraceKit Enables AI-Powered Application Observability
TraceKit simplifies the often-daunting task of achieving advanced observability in complex systems. By combining real-time monitoring with in-depth diagnostic tools, it provides development teams with the insights they need - without the usual headaches or high costs. Designed to focus on critical debugging scenarios, TraceKit makes advanced observability techniques accessible, especially for teams that might struggle with overly complicated or expensive solutions.
Key Features for Observability
TraceKit's standout features are designed to streamline debugging and system analysis:
- Dynamic logging lets developers debug production applications without needing to add logging statements or redeploy code. Log points capture variable state, function parameters, and execution context at the exact moment an issue occurs, offering a level of detail traditional monitoring tools can't provide.
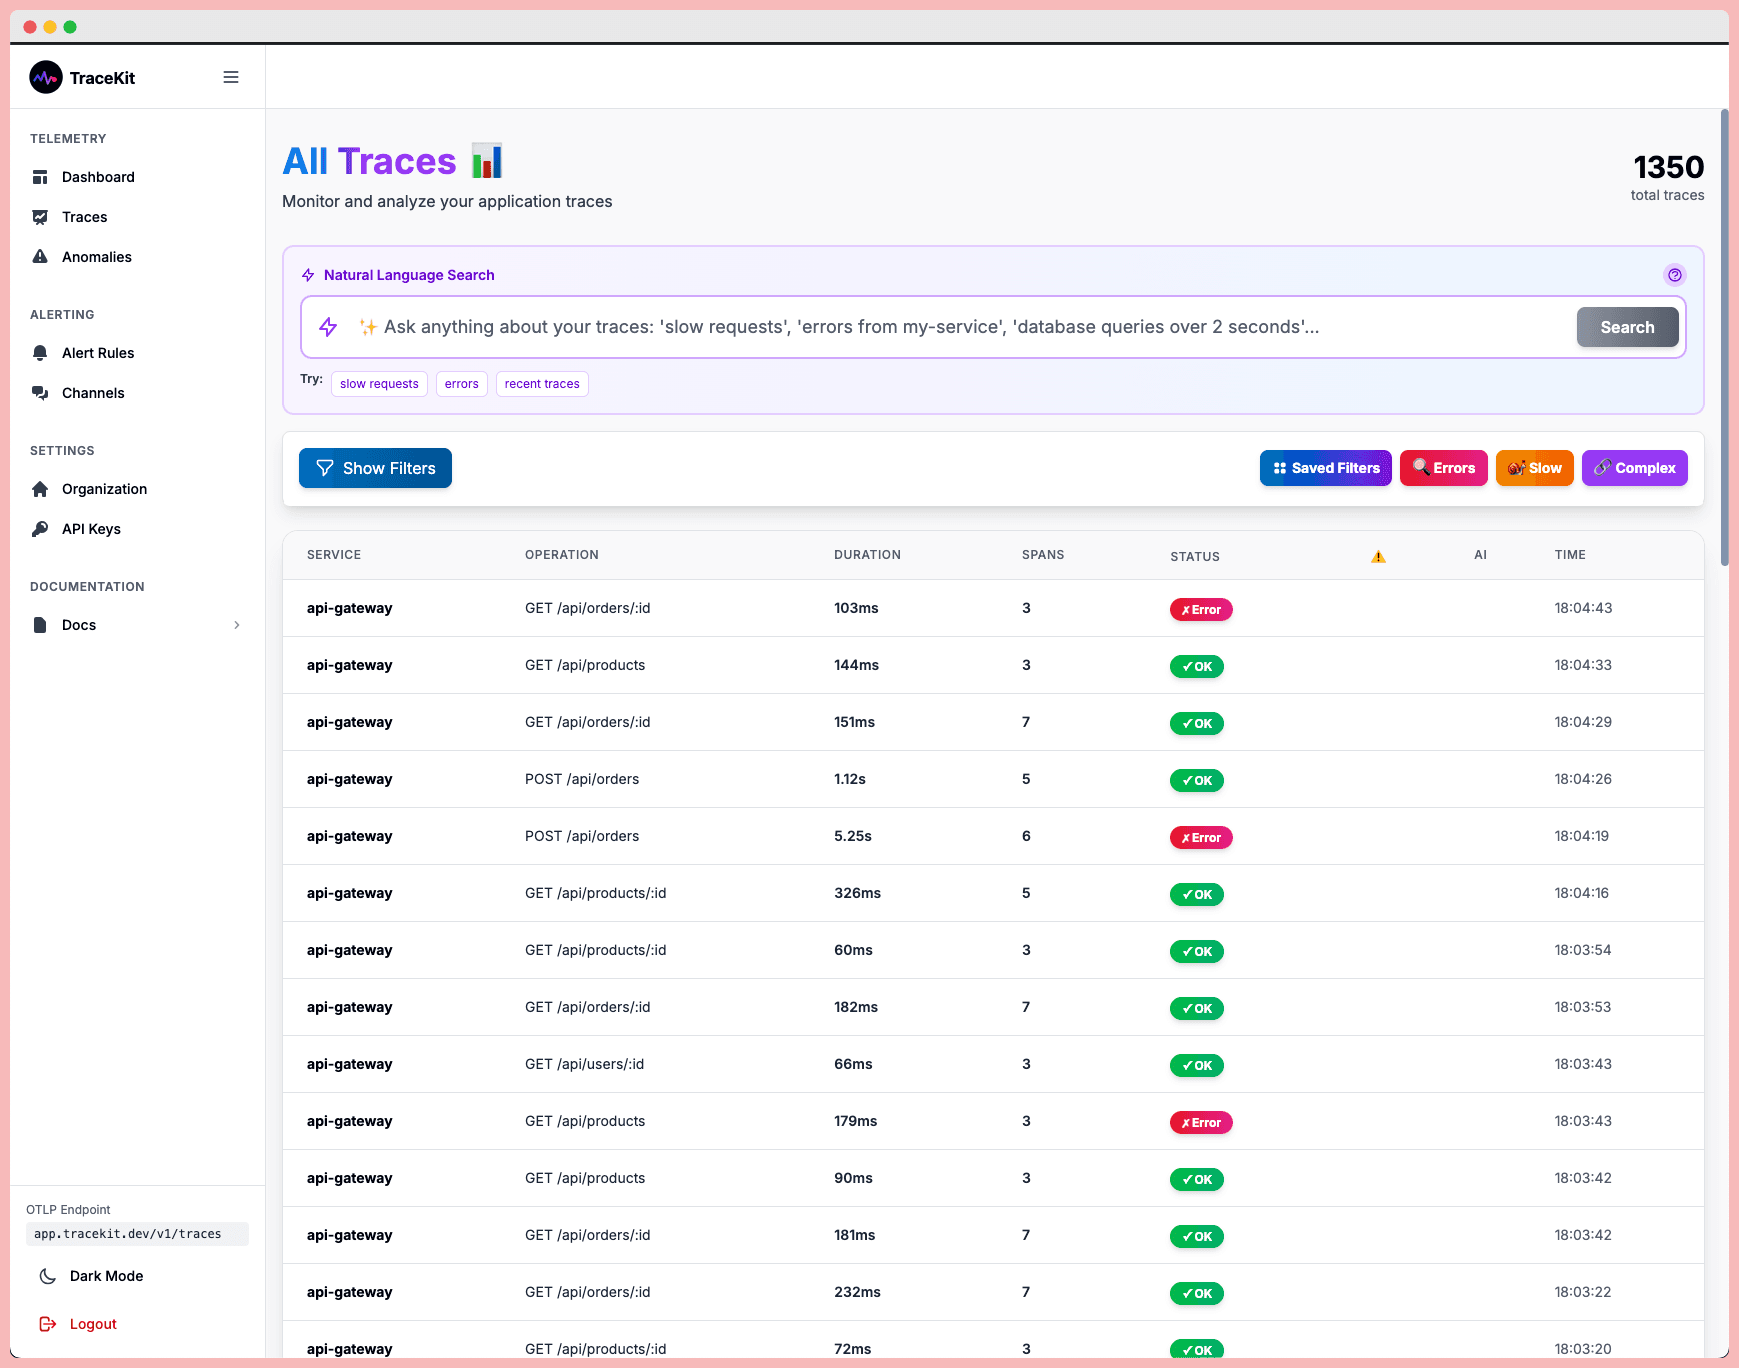
- Automatic distributed tracing tracks requests as they move through microservices, databases, and external APIs, pinpointing bottlenecks along the way. This feature automatically maps the entire request flow, working seamlessly with popular frameworks like Laravel, Express, and Django - no configuration required.
- AI-powered anomaly detection learns the normal behavior of an application and alerts teams when deviations occur. Unlike static thresholds that often trigger false positives, this AI-driven approach identifies real issues before they impact users.
- Trace-to-log correlation bridges the gap between distributed traces and application logs. This unified view allows developers to jump directly from a trace to the relevant log entries, significantly speeding up issue resolution.
- Flame graphs and service dependency maps offer visual insights into performance bottlenecks and system architecture. These tools highlight CPU-intensive functions and reveal complex service interdependencies, turning raw performance data into actionable steps for optimization.
Affordable Plans for Small Teams
TraceKit’s pricing structure is designed with small teams in mind, offering flexibility and cost savings compared to traditional monitoring tools that charge based on infrastructure size.
- Starter plan: $29/month for 1 million traces and 30-day retention.
- Growth plan: $99/month for 10 million traces.
- Pro plan: $299/month for 50 million traces, 180-day retention, and dedicated support.
This request-based pricing model ensures teams only pay for the traces they generate, potentially saving thousands of dollars. Plus, TraceKit’s automatic instrumentation means teams can start gathering insights within minutes, without the need for extensive configuration or specialized DevOps resources.
Another advantage? All plans include unlimited team members, making it an excellent choice for growing startups. This eliminates the worry of rising costs as new developers join, allowing small development teams in the US to maintain robust observability practices as they scale their systems.
Conclusion
Understanding the difference between monitoring and observability is key to building systems that can handle challenges effectively. Monitoring focuses on tracking specific metrics and alerting teams when predefined thresholds are breached. Observability, on the other hand, takes it further by helping teams investigate unknown issues and uncover the underlying causes.
In essence, monitoring is reactive - it answers the question, "What happened?" Observability, however, is proactive - it dives into the "Why did it happen?" and "How can we prevent it?" Successful teams know the value of combining these two approaches for a comprehensive strategy.
For simpler applications, basic monitoring may be enough to keep tabs on metrics like response times and error rates. But as systems grow more intricate with microservices, distributed architectures, and dynamic scaling, observability becomes critical. It provides the context needed to understand how different components interact and where potential issues might arise.
This dual approach not only improves system reliability but also streamlines workflows by leveraging modern tools. When traditional monitoring’s dependability meets observability’s investigative depth, teams can quickly detect problems while also having the resources to diagnose complex, system-wide issues.
For those looking to implement advanced observability without breaking the bank, tools like TraceKit offer a practical solution. With features such as dynamic logs, automatic distributed tracing, and AI-powered anomaly detection, TraceKit provides enterprise-level observability starting at just $29/month. These capabilities empower teams to debug efficiently and maintain peak performance even as their systems grow more complex.
Ultimately, the smartest approach is a blend of both strategies, scaling observability efforts alongside the increasing complexity of your systems and the evolving challenges of debugging.
FAQs
How do application monitoring and observability work together to manage complex systems?
Application monitoring and observability work together to keep complex systems running smoothly. Monitoring focuses on keeping an eye on specific metrics, logs, and alerts to quickly spot and report problems. For example, it can flag symptoms like high latency or a spike in error rates, giving you a heads-up that something's off.
Observability takes it a step further by digging into the why. It analyzes system behavior and interactions in real-time, using tools like distributed tracing or anomaly detection. While monitoring alerts you that an issue exists, observability uncovers the deeper details needed to identify the root cause and fix it.
By combining these two approaches, you get a powerful way to ensure system reliability and quickly troubleshoot production issues.
What makes setting up observability more complex than traditional application monitoring?
Setting up observability goes beyond the basics of traditional monitoring. While monitoring zeroes in on predefined metrics and logs, observability takes a broader approach, pulling in diverse data sources to provide a real-time understanding of how your system behaves.
This typically involves adopting tools and techniques like distributed tracing, event correlation, and anomaly detection. These methods require more extensive system instrumentation and advanced configurations, making the process more intricate. On top of that, teams need to be aligned and equipped to interpret and act on the data effectively, adding another layer of complexity to the setup.
When should a team move beyond basic application monitoring to adopt observability practices?
When a team requires a clearer understanding of their system's behavior - especially in intricate or distributed setups - it's time to think about observability practices. While traditional monitoring answers what's going wrong, observability digs deeper, revealing the why and how. This leads to quicker, more precise troubleshooting.
For teams managing microservices, facing unpredictable performance hiccups, or grappling with scaling issues, observability tools like distributed tracing and log correlation are game-changers. These tools offer real-time insights into system interactions, making it easier to pinpoint and resolve problems. They’re especially useful for fine-tuning performance and ensuring reliability in live production environments.
Related Blog Posts
Related Posts

Best Anomaly Detection Tools for Small Dev Teams (2026)
Compare 6 anomaly detection tools built for small teams. Real-time alerting, easy setup, and affordable pricing. Find the right fit for your stack.
Observability Definition: Complete Guide for 2026
What is observability? Complete guide covering the three pillars (metrics, logs, traces), implementation strategies, and tools for modern software systems.

New Relic Alternative for Bootstrapped Startups
New Relic alternative for bootstrapped startups. Distributed tracing and dynamic logs starting at $29/month instead of $500+. 5-minute setup.