7 Signs Your Production Debugging Process Is Broken
7 warning signs your production debugging is broken: recurring bugs, slow log analysis, invisible anomalies, and more. Diagnose and fix your process.

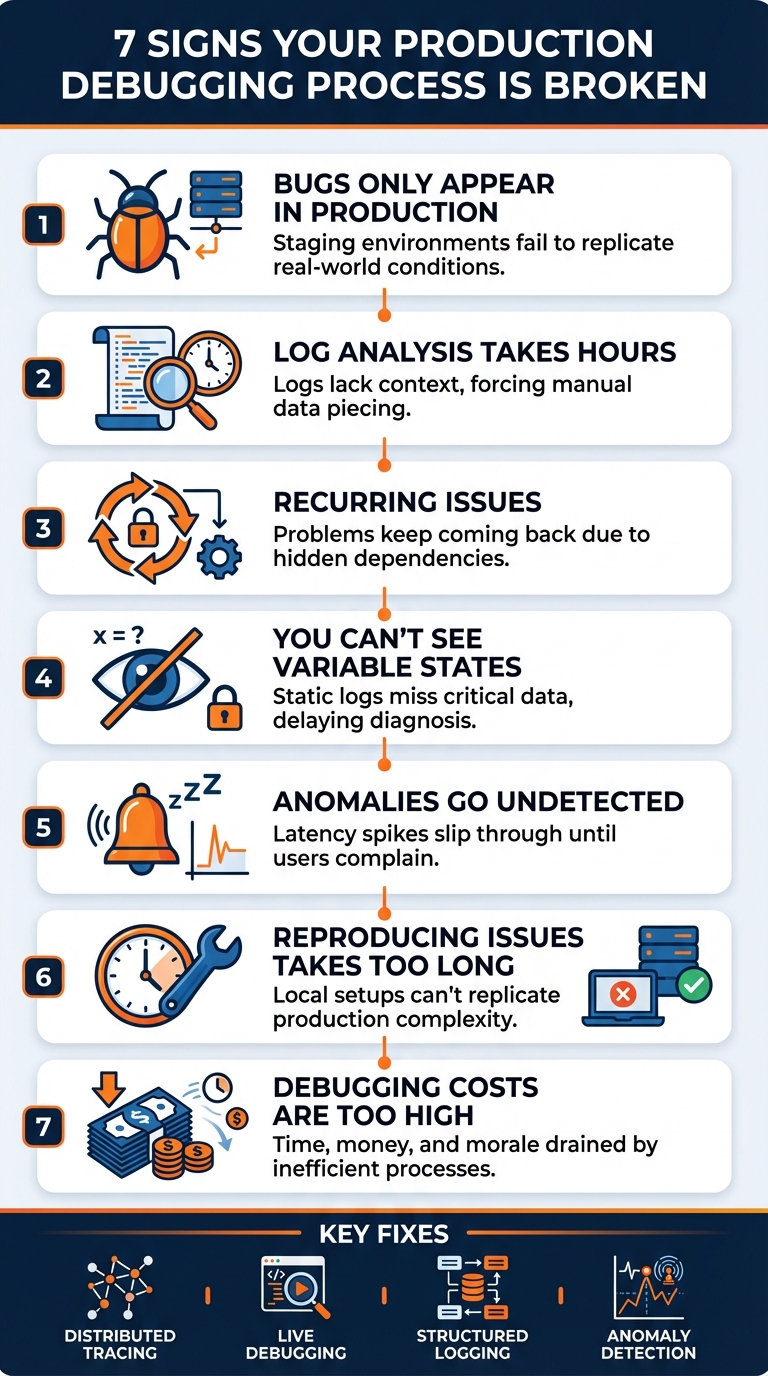
Debugging in production can be a nightmare. If your team is constantly battling recurring issues, wasting hours on logs, or struggling to find root causes, your debugging process might be broken. Here are the seven warning signs:
- Bugs Only Appear in Production: Staging environments fail to replicate real-world conditions, making issues emerge only under live traffic.
- Log Analysis Takes Hours: Logs lack context, forcing engineers to manually piece together data.
- Recurring Issues: Problems keep coming back due to hidden dependencies or quick fixes that don’t address root causes.
- You Can't See Variable States: Static logs miss critical data, leading to delays in diagnosing issues.
- Anomalies Go Undetected: Latency spikes or errors slip through unnoticed until users complain.
- Reproducing Issues Takes Too Long: Local setups can’t replicate production complexity, delaying fixes.
- Debugging Costs Are Too High: Time, money, and morale are drained due to inefficient processes.
Key Fixes:
- Use distributed tracing to follow requests across microservices.
- Implement dynamic logs to view real-time variable states without redeploying.
- Leverage structured logging and trace-to-log correlation for faster analysis.
- Adopt service dependency maps and anomaly detection to catch patterns early.
7 Signs Your Production Debugging Process Is Broken
What Are The Safest Ways To Debug In A Live Production Environment? - Next LVL Programming
Sign 1: Bugs Only Appear in Production
Your code might sail through all staging tests, but as soon as it hits production, unexpected errors start popping up.
What Causes This
Production environments are much more complex and dynamic than staging setups can mimic. When hundreds or even thousands of users interact with your system at once, hidden issues like race conditions, thread pool exhaustion, and cascading failures emerge under the pressure of real traffic.
Laura Nolan, an SRE at Slack, explains: "The biggest production outages come not from big failures, but small ones chained together".
The differences between staging and production extend beyond just traffic volume. Staging often runs on smaller infrastructure with synthetic data, missing key production configurations like credential rotations or network partitions. Real user data, combined with peak traffic, can expose edge cases, memory leaks, or even bottlenecks like a slow third-party API or an overloaded connection pool, which controlled tests simply can't replicate.
Modern distributed systems, especially those built on microservices, add another layer of unpredictability. Unlike traditional monoliths, these systems are harder to debug because cause-and-effect relationships aren't always obvious. Even seasoned engineers struggle to predict how such systems will behave under live conditions. In fact, programmers reportedly spend nearly half their time debugging. Tackling these challenges requires a mix of smarter tracing and dynamic log tools.
How to Fix It
To address production-only bugs, start by implementing distributed tracing. This method tracks a request's journey across all microservices using unique trace IDs, helping you identify errors and bottlenecks more effectively than isolated log entries. Traces provide a clear picture of the sequence of events leading to failures.
Another powerful tool is dynamic logs, which allows you to inspect variable states and stack traces in real time without halting the deployment process. This approach is particularly useful for diagnosing unpredictable behavior in complex systems, as it eliminates the guesswork of adding endless logs.
You can also define invariants - runtime checks that enforce domain-specific rules (e.g., "account balance must never be negative"). When these rules are violated, they trigger immediate alerts and can be recorded directly in your traces. Lastly, use feature flags to isolate changes and enable quick rollbacks in case production-specific bugs arise.
Sign 2: Log Analysis Takes Hours
When a production issue strikes, your team ends up spending hours combing through enormous log files and scattered data instead of zeroing in on the root cause right away.
Why This Happens
The main problem boils down to lack of context. A single log entry with an error message might explain what went wrong, but it doesn’t tell you why. Without critical details like the surrounding stack trace, the request ID that triggered the error, or the specific payload involved, engineers are left piecing together clues manually. This process often involves connecting logs, traces, and metrics by hand, which wastes valuable time.
"Troubleshooting issues in a microservices-based environment using legacy monitoring tools would have required a large team of engineers to spend several hours sifting through separate data sets and manually correlating data." – Splunk
Modern distributed systems make this even harder. When a request moves through multiple microservices, figuring out which service caused the failure becomes a daunting task without proper tools [25, 27]. To make matters worse, teams often either log too much or too little. Add in the constant context switching between IDEs, log aggregators, and dashboards, and developers quickly lose focus.
A better approach? Combine trace-to-log correlation with visual tools to simplify the debugging process.
How to Speed Up Debugging
To cut down log analysis time, focus on trace-to-log correlation. This method links logs directly to traces using unique trace IDs, so you can instantly connect log entries to specific failed requests [24, 25]. Instead of wading through endless log lines, you can simply click on a trace and see only the relevant logs for that transaction.
Pair this with visual tools like flame graphs and dependency maps to quickly locate delays. Add automatic error linking to trace exceptions back to their exact code lines, which removes much of the guesswork.
Finally, structured logging with machine-assisted filtering can auto-group results, slashing analysis time from hours to just minutes [25, 26].
Sign 3: The Same Issues Keep Coming Back
If your team is constantly battling the same production problems week after week, it’s a clear sign that the underlying issues aren't being resolved. Instead of addressing the root cause, you're stuck treating symptoms, which drains time, money, and your team's reputation.
Why Issues Recur
One major culprit behind recurring problems is hidden service dependencies. Without a clear map of how your microservices interact, it's nearly impossible to pinpoint where things go wrong. This lack of visibility often leads to cascading failures. For example, a bottleneck in a downstream service - like a database or a third-party API - can repeatedly bring your entire system to its knees. Configuration mismatches, such as hard-coded Kafka partition counts that don’t scale with your infrastructure, can also cause ongoing problems like intermittent data loss or missing events.
Architectural flaws can make matters worse. Patterns like "retry storms" occur when latency prompts clients to retry requests, doubling the load on your system. Similarly, "cache stampedes" and "timeout amplification" can lead to repeated outages. Quick fixes, like temporarily scaling up capacity, might restore functionality for a while, but they won't address deeper issues like memory leaks or inefficient SQL queries.
These recurring challenges require a more focused approach to prevent them from happening again.
How to Stop Repeat Incidents
To break the cycle of recurring issues, combine distributed tracing with service dependency maps. This will help you identify which service fails first and how it impacts the rest of your system. Tools that generate automated, color-coded maps (green/yellow/red) can highlight the health of each dependency and show the scope of an incident's impact.
Incorporate AI-driven anomaly detection to catch unusual patterns - such as spikes in P95 latency or error rates - before they escalate into major problems. Define and enforce runtime invariants (like ensuring "balance must never be negative") within your code to catch logic errors early. Additionally, adopt a "Trace Tuesday" routine, where your team reviews the slowest 1% of traces weekly. This proactive practice helps you spot and resolve potential bottlenecks before they evolve into system-wide outages.
Sign 4: You Can't See Variable States During Incidents
When debugging in production, not being able to view variable states during incidents can be just as frustrating as dealing with delayed log analysis. Logs, by design, only capture data that was pre-programmed to be recorded, which means critical variable states often go untracked. This leads to a tedious cycle of adding new logs, rebuilding the application, and redeploying - all while the clock is ticking. Not only does this waste valuable time, but it can also disrupt users and still fail to provide the insights you need.
Why Static Logs Aren't Enough
Static logs have a major limitation: they only record what you anticipated needing. If a variable's value wasn’t logged before the incident occurred, that data is gone forever. This creates what’s often called an "anticipation gap" - you can’t answer questions about information you didn’t plan to log in advance.
Even with extensive logging, you face a tough trade-off. Too many logs can overwhelm engineers with irrelevant data and even slow down system performance. On the other hand, sparse logging risks missing the key details required to diagnose the root cause. The problem becomes even more pronounced in modern microservices or serverless architectures, where logs are scattered across numerous locations. Reconstructing the full state of a request as it moves through the system becomes nearly impossible. To address these challenges, dynamic data capture through dynamic logs are becoming a necessity.
How Dynamic Logs Changes the Game
Dynamic log tools, like dynamic logs (log points), allow you to capture real-time variable state and stack traces without interrupting or redeploying your application. These tools rely on dynamic instrumentation to pull data on demand, so you can retrieve specific variable values without needing to replicate the issue in a local environment. Some platforms even provide features like Exception Replay, which lets you see local variable values at the exact moment an exception occurred, directly within your IDE.
Adopting dynamic logs can dramatically improve your efficiency. For example, it can cut Mean Time to Resolution (MTTR) by up to 60%, and it enables engineers to identify issues up to 80% faster compared to traditional methods. Instead of guessing what might have gone wrong, these tools give you precise, actionable data about what actually happened in production. Memory dumps - snapshots of your application’s processes that include memory allocation, thread states, and object data - are another powerful resource. They provide deep insights without requiring constant redeployment.
Sign 5: Anomalies Go Undetected for Too Long
When issues like latency spikes or rising error rates go unnoticed, they can wreak havoc on system reliability. By the time users start complaining or monitoring alerts finally go off, the damage is often already done - lost revenue, unhappy customers, and chaotic teams scrambling to fix things. Worse, finding the root cause becomes a much harder task.
The Problem with Reactive Debugging
Traditional monitoring tools often rely on averages, which can hide critical edge-case problems. Take this example: a web service handling 1,000 requests per second might report an average latency of 100ms, which seems fine. But if 1% of those requests are taking 5 seconds, that’s 10 users every second enduring a terrible experience. Over time, those slow requests can snowball into a bigger issue, potentially dragging down your median response time as the problem spreads.
Adding to the challenge is alert fatigue. When monitoring systems bombard engineers with non-actionable alerts, it’s easy to miss the truly critical ones. As Rob Ewaschuk, an SRE at Google, explains:
"Every time the pager goes off, I should be able to react with a sense of urgency. I can only react with a sense of urgency a few times a day before I become fatigued".
This constant noise can obscure real outages, delaying responses and making it harder to catch early warning signs.
Another issue lies with distributed tracing tools that rely on aggressive data sampling to save costs. While this approach reduces overhead, it often misses the exact signals - like intermittent errors or sudden latency spikes - that are crucial during incidents. In complex microservices architectures, where requests pass through dozens of interconnected services, missing these signals can leave you clueless about the source of a failure.
How to Detect Issues Earlier
To move beyond these reactive pitfalls, you need a proactive approach. Start by focusing on the Four Golden Signals: Latency, Traffic, Errors, and Saturation. These metrics offer a well-rounded view of your system's health and can help you identify problems before they escalate into full-blown outages.
Another powerful tool is tail-based sampling. Unlike traditional sampling, which randomly selects traces at the beginning of a request, tail-based sampling evaluates the entire trace after it completes. It then keeps only the traces that meet specific criteria, such as errors or high latency. This ensures you're capturing the data that truly matters. Pair this with effective visualization tools to pinpoint bottlenecks faster, and you’ll dramatically reduce the time it takes to investigate and resolve issues.
Sign 6: Reproducing Issues Takes Too Long
When a bug surfaces in production, every second counts. But instead of diving straight into a fix, your team might find itself tangled in hours - or even days - of trying to recreate the problem locally. You tweak settings, test with mock data, and restart services, all while users are stuck dealing with the issue. This delay in reproducing bugs is a clear red flag that something is off with your debugging process.
Why Reproduction Fails
The root cause often lies in the disconnect between local or staging environments and the complexity of production. For example, your development setup might handle a handful of requests at a time, while production juggles thousands, each with unique data patterns, concurrency issues, and edge cases that are nearly impossible to mimic. Nicholas Fane, a software engineer, once tackled a payment bug at an e-commerce platform where 23% of transactions were failing. The problem? A specific database query inefficiency triggered only by real customer data - user IDs ending in certain digits, to be exact.
Modern cloud-native systems, with their microservices and distributed architectures, add another layer of complexity. These setups often create failure modes that emerge only in production. Configuration mismatches between cloud environments and local setups lead to the dreaded "it works on my machine" scenario. This gap makes local reproduction feel like chasing a moving target.
Fragmented tools make things worse. Logs, metrics, and traces scattered across different platforms force engineers to spend hours piecing together the puzzle. Jean-Philippe Boudreault, Director of Engineering at AppDirect, puts it well:
"One of the biggest misconceptions about troubleshooting systems is that it requires deep, specific technical knowledge to locate and solve production issues. This assumption can often result in extending the time between the discovery and resolution of a problem".
In many cases, traditional methods of reproducing issues locally can drag on for 2 to 3 days.
How to Reproduce Issues Faster
Instead of endlessly trying to replicate production locally, focus on improving your debugging capabilities in the production environment itself. This shift can cut down reproduction time dramatically.
- Use distributed tracing: This allows you to track the exact journey of a failing request through your microservices, eliminating much of the guesswork.
- Trace-to-session correlation: By linking traces to specific user sessions using session IDs, IP addresses, or activity logs, you can zero in on user-specific problems. Nicholas Fane’s team used this approach, adding targeted logging and running "EXPLAIN" query analyses directly in production. They pinpointed the issue within 3 hours and avoided an estimated $50,000 in lost revenue.
- Automatic instrumentation: Tools like OpenTelemetry can standardize telemetry collection across all services, reducing the manual effort required to gather data. Mike Simon, Developer Evangelist at Splunk, explains:
"You cannot scale observability by adding more tickets, more admins, more process. You scale it by removing friction and enabling teams to help themselves".
- Feature flags: These allow you to enable verbose logging or debugging code in production for specific users without disrupting the system for everyone else. This targeted approach ensures you capture the exact data needed to resolve issues quickly.
Sign 7: Debugging Costs Are Too High
Prolonged debugging eats up engineering hours, drains revenue, and takes a toll on team morale.
The Hidden Costs of Inefficient Debugging
The financial ripple effects of inefficient debugging go well beyond the time developers spend on it. In many companies, tracking down and fixing a production bug can drag on for days - or even weeks. Take, for instance, a situation where three senior engineers spent 240 minutes wrestling with a Kubernetes issue that ultimately took just five minutes to resolve once the right question was asked. As Anshul Sao, Co-Founder & CTO at Facets.cloud, bluntly puts it:
"The brutal truth? They spent 240 minutes debugging something that took 5 minutes to fix, all because they forgot to ask a 10-second question."
This isn’t an isolated case. Around 95% of production issues stem from recent, seemingly simple changes. Yet engineers often waste hours chasing complex platform bugs that don’t exist. The problem worsens when teams rely on outdated trial-and-error methods: adding logging statements, redeploying, and then scouring logs. This constant cycle of context switching slows down the entire delivery pipeline.
And it’s not just about wasted hours - production bugs can directly hit your bottom line. Service outages, broken customer experiences, and long-term brand damage are all on the table. For example, if a critical user journey like a checkout process stays broken for too long, you’re not just losing immediate sales - you’re also chipping away at customer trust. Add in the stress of high-pressure incident responses and the risk of team burnout, and the true cost becomes overwhelming.
How to Reduce Debugging Costs
To tackle these costs, it’s essential to streamline your debugging process and cut out unnecessary time sinks. Start by automating delivery pipelines so developers can push fixes without constant context switching. Using feature flags allows you to isolate changes and disable problematic code paths instantly, avoiding full system rollbacks.
Move away from the old log-redeploy cycle by adopting tools that provide real-time access to production data without pausing or redeploying the application. Distributed tracing can help map out the cause and timing of failures, eliminating guesswork. Pair it with AI-powered analysis to significantly reduce your Mean Time to Resolution (MTTR). During live incidents, focus on mitigating the impact first - roll back the deployment or scale up capacity immediately. Save the deep dive into root cause analysis for later. As Anshul Sao wisely points out:
"Production users don't care about your learning journey. They care about working software."
Conclusion: Building a Better Debugging Process
After identifying the seven signs of a flawed debugging process, it’s time to turn those insights into actionable improvements. Start by auditing your current approach. Review postmortem data to uncover recurring failure patterns and gaps in your logging setup. Create a detailed map of your debugging workflow to expose bottlenecks and inefficiencies.
"The best debuggers slow everything down, even when pressure is high".
These strategies not only help resolve issues faster but also lay the groundwork for a more reliable and efficient debugging process.
Take the leap from reactive to proactive debugging. Modern tools like distributed tracing and dynamic logs can slash Mean Time to Resolution (MTTR) by as much as 60%. Integrating runtime invariants, such as rules like "balance must not be negative", ensures potential issues are caught early, preventing them from escalating into critical incidents.
When incidents occur, focus on stabilizing the system first. Roll back deployments, scale capacity, or reduce traffic to minimize customer impact immediately. Once stability is restored, shift your attention to investigating root causes.
"In production, you are not 'fixing bugs.' You are restoring a system to a stable state without causing collateral damage".
Looking ahead, debugging will rely on proof-driven workflows. Deterministic reproductions and actionable observability will become essential tools to maintain your team’s productivity and protect system integrity. By adopting these methods, you’ll not only reduce downtime and cut costs but also build a system that grows stronger and more resilient over time.
FAQs
What role does distributed tracing play in improving production debugging?
Distributed tracing offers an end-to-end perspective on how a request moves through your system, covering all interconnected services. This makes it easier to zero in on the specific component where something went wrong, understand the chain of operations that led to the problem, and identify the root cause - without the tedious task of combing through logs manually.
With its ability to provide detailed insights into system performance, distributed tracing cuts down on debugging time. This means your team can address production issues faster, reducing downtime and boosting the reliability of your system.
What are the advantages of using dynamic log tools in production?
Dynamic log tools let you tackle issues directly within a running production environment, eliminating the need to replicate them elsewhere. This gives you real-time insights into how your application is behaving, making it easier to identify and fix problems on the spot.
By resolving bugs as they happen, these tools help cut down on downtime and streamline the debugging process. They’re particularly helpful in complex systems where recreating issues in a test environment can be both difficult and time-consuming.
Why do bugs appear in production even after thorough testing in staging?
Bugs can sneak into production because staging environments, no matter how carefully set up, can't perfectly mimic real-world conditions. Things like unexpected user behavior, sudden traffic surges, small configuration mismatches, or how external systems interact often expose edge cases that testing might miss.
On top of that, production systems deal with live data and unpredictable workloads, making it impossible to foresee every situation during staging. This unpredictability underscores why having strong monitoring and debugging tools is so critical - they help you quickly spot and fix those production-only issues.
Related Blog Posts
Related Posts

Production Debugging Checklist for Small Dev Teams
Production debugging checklist for small dev teams: structured logs, focused alerts, fast triage, tracing, fixes, and post-mortems to prevent repeat issues.

Laravel Production Debugging: Beyond Logs and Error Tracking
Debug Laravel in production beyond dd() and Log::info(). Use Telescope, dynamic logs, distributed tracing, and performance profiling.

Debug Production Without Redeploying: Step-by-Step Guide
Step-by-step guide to debugging production without redeploying. Set up dynamic logs for PHP, Node.js, Go, and Python in minutes.