The Real Cost of the Guess-and-Redeploy Cycle
The guess-and-redeploy cycle costs 1,000x more than catching bugs early. Break the cycle with dynamic logs and AI-powered observability.

When developers don't have enough visibility into their systems, they often rely on trial-and-error to fix bugs in production. This guess-and-redeploy cycle wastes time, money, and damages customer trust. Each failed attempt to fix an issue leads to repeated deployments, higher costs, and risks of introducing new problems.
Key Takeaways:
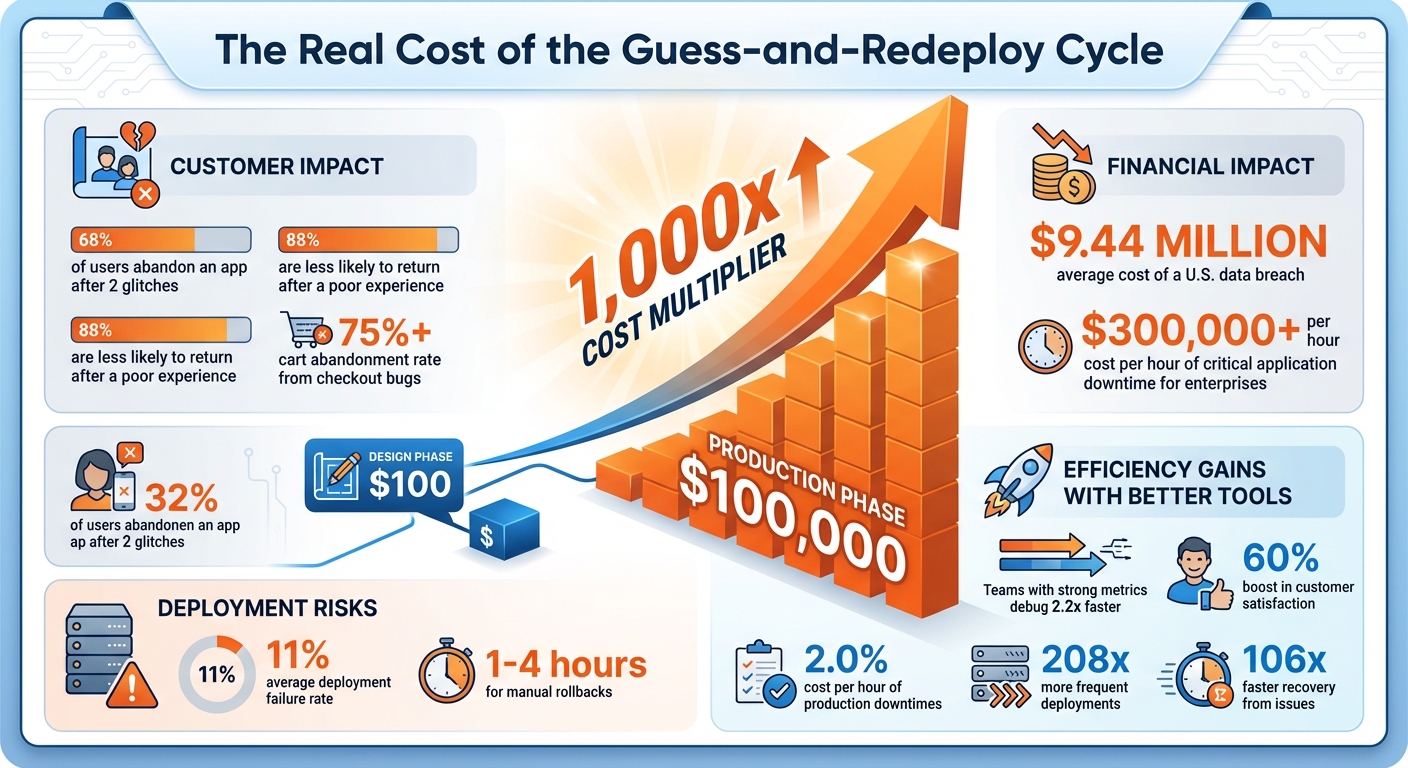
- Fixing bugs in production can cost 1,000x more than addressing them during design.
- Frequent redeployments harm reliability and customer experience - 68% of users abandon apps after two glitches.
- Tools like dynamic logs and AI-powered observability help debug issues without redeployments, saving time and reducing risks.
Switching to production-safe debugging tools can prevent costly errors, improve workflows, and protect your brand's reputation.
The Financial Impact of Production Bugs: Cost Comparison by Development Phase
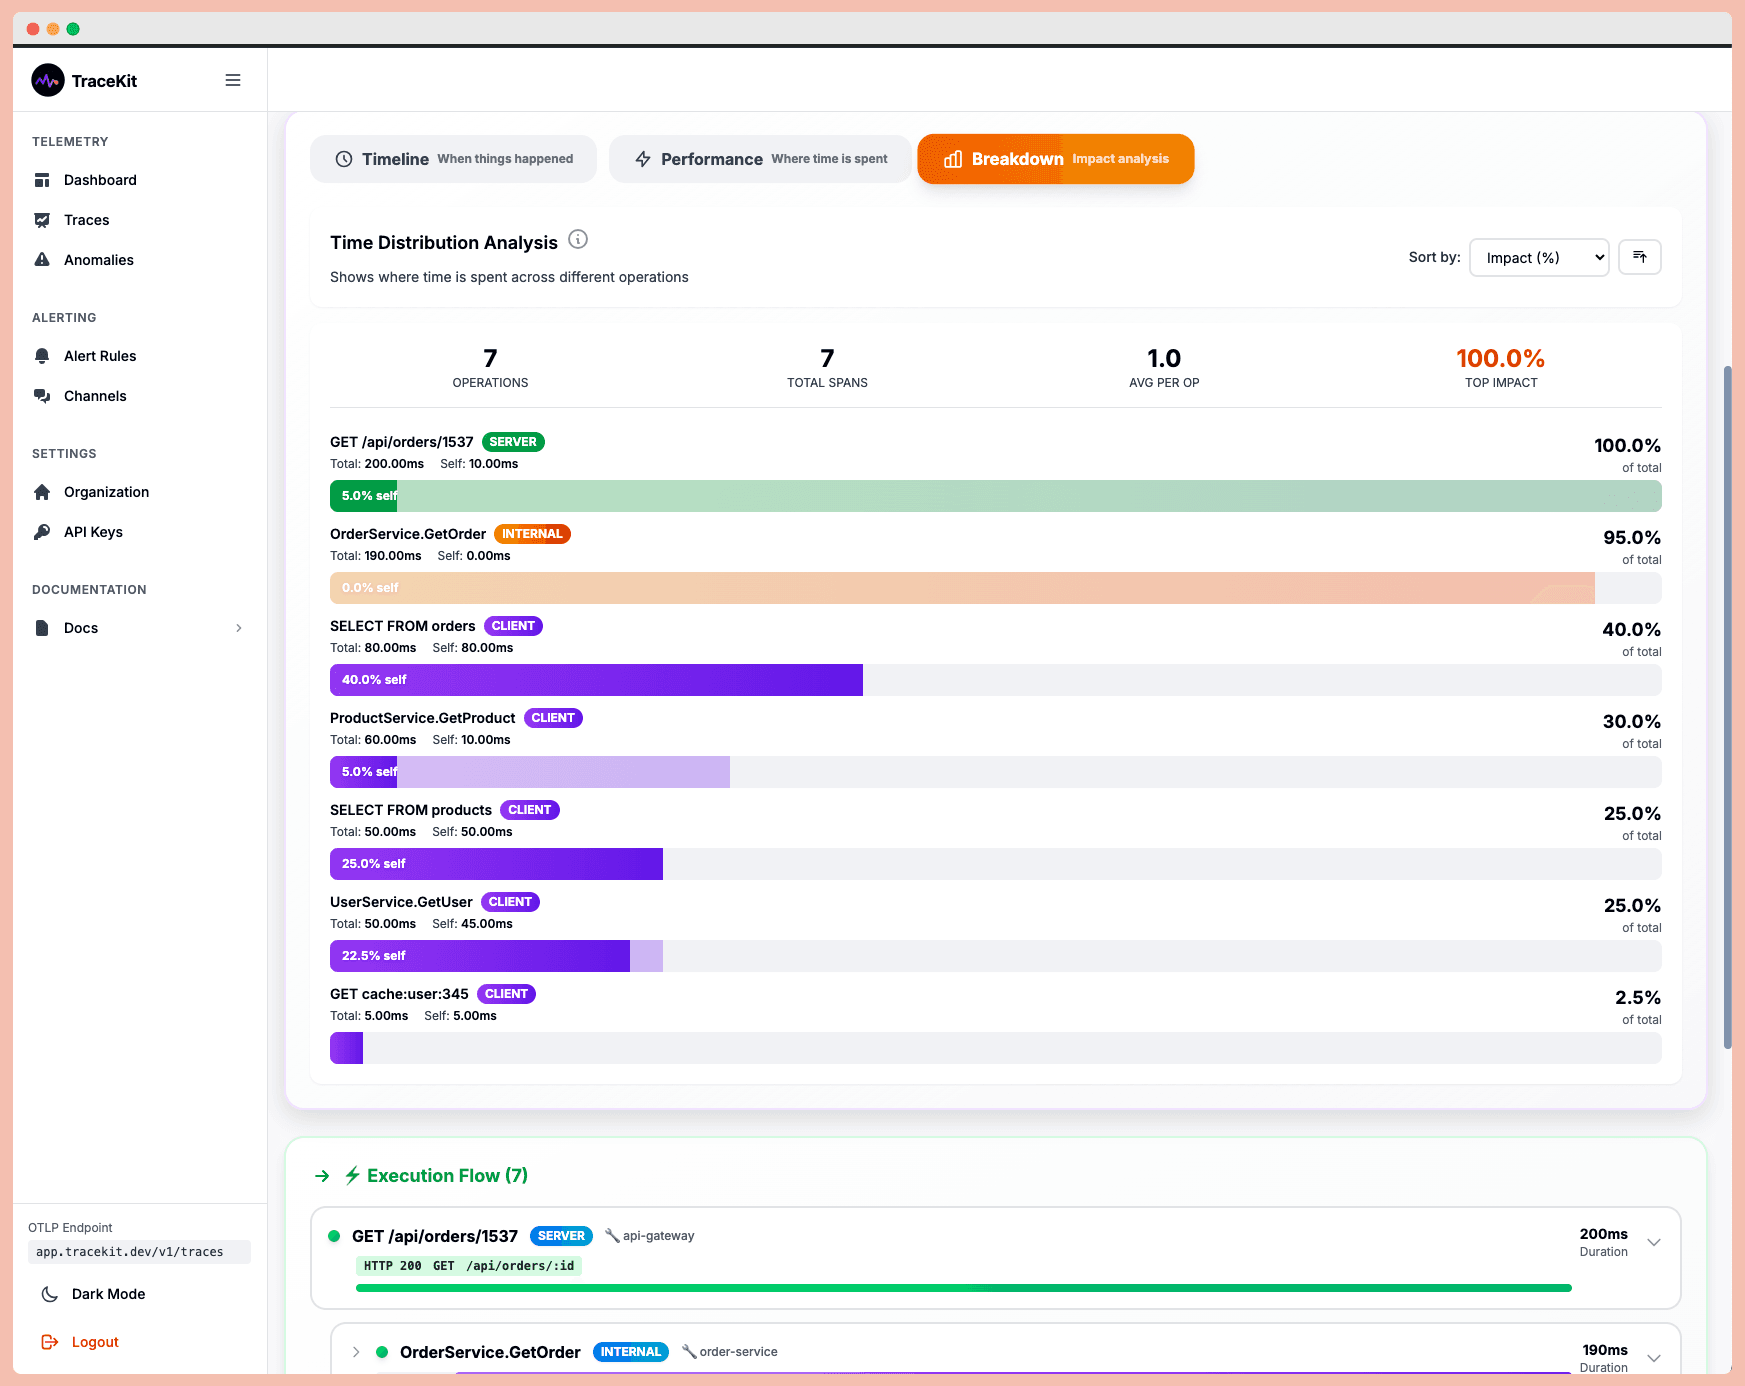
Iterating on Observability: Reproducing Production Errors in Isolation
The True Costs of Guess-and-Redeploy
The guess-and-redeploy approach doesn’t just delay launches - it creates hidden costs that ripple through teams and operations, impacting productivity, finances, and customer trust.
Developer Time Lost to Debugging
When developers are stuck chasing bugs in production and redeploying fixes, it pulls them away from creating new features or driving innovation. This constant firefighting not only derails their focus but also eats into valuable time that could be spent on advancing the product. Every hour spent on debugging is an hour lost to potential progress.
Financial Impact on Teams and Businesses
The financial burden of this cycle is staggering. Fixing a bug in production can cost up to $100,000, compared to just $100 during the design phase - a difference of 1,000 times. But that’s just the start. Costs pile up from repeated cloud deployments, growing technical debt, and delayed feature rollouts. On top of that, 11% of deployments fail on average, and manual rollbacks can take anywhere from an hour to as much as four hours in the worst cases. During these delays, customers often face service disruptions, further compounding the financial and reputational damage.
Reliability and Customer Experience Risks
The guess-and-redeploy cycle doesn’t just drain resources - it also jeopardizes system reliability and user trust. Each redeployment risks introducing new problems or worsening existing ones. And customers are unforgiving: 68% of users abandon an app after encountering two glitches, while 88% are less likely to return after a poor experience. In e-commerce, the stakes are even higher - a single checkout bug can drive cart abandonment rates past 75%.
Security vulnerabilities are another critical concern. Frequent redeployments increase the risk of breaches, and in the U.S., the average cost of a data breach now stands at $9.44 million. These issues don’t just hurt your bottom line - they can permanently damage your brand’s reputation. Reducing redeployments isn’t just about saving money; it’s essential for maintaining customer trust and protecting your business’s long-term health.
How to Stop the Cycle: Tools and Methods
Breaking out of the endless loop of guesswork and redeployments requires tools that allow you to debug production issues without interfering with your deployment pipeline. Modern debugging solutions eliminate the need for log statements, repeated redeployments, and wasted development cycles.
Dynamic Logs for Production Debugging
Dynamic logging provides a way to inspect variable state, application behavior, and execution paths in your running production code without halting your application or deploying new code. By adding a dynamic log point, you can capture critical information like request payloads, headers, and variable state exactly when an issue occurs.
This approach introduces minimal performance overhead - less than 5% - so your application continues to run smoothly. Setup is straightforward, typically requiring no configuration and taking less than four minutes to instrument. Supported languages include PHP (Laravel, Symfony), Node.js, Go (Gin, Echo), Python, Java, and Ruby.
"The dynamic logs feature is my favorite - lets me inspect production issues without redeploying." - Terry Osayawe, Co-Founder, TrustyPost
Here’s a real-world example: Alex, a solo founder running a subscription SaaS with Node.js, encountered random payment failures in production. Despite Stripe webhooks consistently returning 200 status codes, the bug was impossible to reproduce locally. Instead of endlessly adding logs and redeploying, Alex set a dynamic log point at the webhook handler. When the issue occurred again, the SDK captured the full request payload, headers, and variable state. Alex uncovered a race condition caused by an async database write and resolved it in a single deploy. Debugging time: just 10 minutes.
AI-Powered Observability and Anomaly Detection
AI-powered observability platforms take debugging to the next level by using artificial intelligence to identify anomalies, detect issues, correlate events, and suggest probable root causes in real time. These platforms significantly reduce the time spent diagnosing problems by automatically connecting logs, metrics, and traces. This provides a complete picture of not just what went wrong, but why it happened.
Automated tools driven by AI and machine learning can quickly sift through massive codebases, pinpointing errors or narrowing down problematic areas for developers to investigate. For applications that include AI or LLM components, AI observability tools monitor aspects like model performance, latency, token usage, and model drift alongside traditional telemetry. This makes it easier to debug unpredictable AI behavior.
For instance, a checkout service experienced timeouts affecting only U.S. West region users due to tail latency spikes in the payment service. By taking a code-level snapshot, the team discovered a misconfigured interceptor that bypassed the circuit-breaker logic. The problem was identified and resolved in minutes, without the need for redeployments or trial-and-error debugging.
These tools are transforming debugging workflows, setting the stage for more efficient practices that will be explored in the next section.
Best Practices for Better Debugging Workflows
Breaking out of the frustrating cycle of guessing and redeploying requires a more structured approach to debugging. By combining smart tools with proven practices, teams with strong metrics programs can debug 2.2x faster and boost customer satisfaction by 60%. These strategies work hand-in-hand with modern debugging tools to make workflows more efficient.
Linking Traces, Logs, and Database Monitoring
One of the most effective ways to streamline debugging is by combining trace-to-log correlation with database monitoring. This setup automatically connects error events, logs, and database activity, giving you a clear picture of what’s happening without the need for tedious manual searches. For example, tools like TraceKit simplify this process by offering automatic instrumentation for popular frameworks like Laravel and Express. With features like trace-to-log correlation, database query monitoring, and user session tracking, you can get a comprehensive view of issues without heavy configuration.
Metrics That Keep You on Track
Tracking the right metrics is key to ensuring your debugging workflows are actually making a difference. While tools can provide quick insights, metrics help you maintain long-term efficiency. Research from DORA highlights that teams using effective metrics deploy 208x more frequently and recover from issues 106x faster.
Start with Mean Time to Recovery (MTTR) to measure how quickly services are restored after an issue. A lower MTTR signals improved debugging efficiency. Another useful metric is Change Failure Rate, which reflects how well pre-deployment testing and debugging are working. Additionally, tracking unplanned work - like emergency bug fixes or production issues - can point out areas where workflows are still reactive. Set clear baselines for these metrics and aim for continuous improvement to refine your processes over time.
Conclusion: Moving Toward Efficient Debugging
The guess-and-redeploy cycle comes with a hefty price tag. Fixing a bug during the design phase might cost around $100, but that same bug in production could skyrocket past $100,000. This sharp increase in costs highlights why reactive debugging methods just don't cut it anymore.
Switching to production-safe debugging tools can make a world of difference. Tools like TraceKit let you set dynamic logs in production, trace requests across distributed systems, and even leverage AI-powered anomaly detection - all without needing to redeploy. This proactive approach doesn’t just smooth out workflows; it also helps catch and fix issues before they spiral into customer-facing problems. The financial impact of such tools is hard to ignore, especially when they prevent issues from escalating into costly disasters.
"Quality Assurance is not a cost center; it's a profit-protection center." - CONSOLTO
To put things into perspective, the average cost of just one hour of critical application downtime for enterprise companies can exceed $300,000. By implementing effective debugging workflows, businesses can improve system reliability while reaping substantial cost savings. Production-safe debugging tools directly address the inefficiencies and financial losses tied to reactive debugging, reinforcing the idea that better visibility and precision are essential.
Breaking free from the guess-and-redeploy cycle starts with adopting tools that provide a clear view into production environments without the risks and delays of constant redeployment. Whether you're part of a small team or a growing enterprise, investing in these tools not only minimizes downtime but also streamlines development efforts. Strong observability eliminates the steep costs of late-stage bug fixes and saves developers from wasting time on reactive problem-solving. In the end, this shift turns debugging from a resource drain into a strategic advantage, boosting both quality and profitability.
FAQs
What are dynamic logs, and how do they help eliminate the guess-and-redeploy cycle?
Dynamic logging lets developers capture variable state directly in a live application - no redeployment required. This approach removes the need for guesswork by enabling real-time debugging, making it easier to pinpoint and fix issues quickly.
With instant insights into how code performs in production, dynamic logs help save time, minimize downtime, and simplify the debugging process. The result? Fewer disruptions for your team and a smoother experience for your users.
How much more expensive is it to fix bugs in production compared to earlier stages?
Fixing bugs during production can be a pricey ordeal. Research indicates it might cost 4 to 5 times more than addressing them during the design phase - and up to 30 times more than catching them early in the requirements or planning stages.
Why the steep costs? It comes down to factors like system downtime, disrupted user experiences, and the manpower needed to diagnose, fix, and redeploy updates. Tackling issues earlier doesn’t just save money; it also helps avoid delays and boosts the reliability of your product.
How can AI-powered observability tools make debugging faster and more effective?
AI-powered observability tools make debugging much easier by offering real-time monitoring, automated issue detection, and contextual insights. These features cut down on the trial-and-error process, enabling developers to identify and fix problems quickly - without the need to redeploy code.
With faster issue resolution and reduced downtime, these tools not only save teams time but also help maintain stable and dependable production environments.
Related Blog Posts
Related Posts

Five-Step Observable Debugging for Production Apps
Reduce app downtime by 98% with this five-step observable debugging framework. A systematic process for production debugging across any tech stack.
Debug Production Issues 10x Faster with Tracing
Debug production issues 10x faster with distributed tracing. Track requests across microservices, find bottlenecks, and resolve errors without log diving.

Laravel Production Debugging: Beyond Logs and Error Tracking
Debug Laravel in production beyond dd() and Log::info(). Use Telescope, dynamic logs, distributed tracing, and performance profiling.