
Debugging in production is tricky. The choice between logs and live breakpoints can make or break your troubleshooting process. Logs provide a historical record of events, while live breakpoints + distributed tracing let you inspect your application’s state in real time without stopping execution. Here’s the key takeaway:
- Use logs when you need to track event sequences, diagnose issues across distributed systems, or maintain a historical record.
- Use live breakpoints for pinpointing specific issues, inspecting variables, or debugging problems that can’t be replicated in development.
Logs are great for understanding patterns and large-scale issues, but they require foresight to log the right data. Live breakpoints, on the other hand, allow dynamic investigation without redeployment, making them ideal for targeted debugging. Combining both offers a balanced approach to resolving production bugs efficiently.
Debugging In A Production Environment with Shai Almog I Postman
sbb-itb-0fa91e4
How Logs and Live Breakpoints Differ
Logs and live breakpoints serve distinct purposes and operate in fundamentally different ways. Logs are pre-defined records of events that are written to a file or standard output. They create a chronological record of what has happened in your application. Live breakpoints, on the other hand, act as on-demand probes, allowing you to capture a snapshot of your application’s state – variables, stack traces, and more – without interrupting execution.
The main difference? Logs show you what you planned to see, while live breakpoints reveal what you need to see in the moment. As the Microsoft Engineering Fundamentals Playbook explains:
Logs are discrete events with the goal of helping engineers identify problem area(s) during failures.
Live breakpoints go a step further by letting you inspect running code in real-time, capturing the complete context of a specific line – including all local variables and the full call stack. Unlike logs, which only record pre-defined data points, live breakpoints allow you to gather information dynamically. If you didn’t log a particular variable, you’d have to redeploy your application with updated logging to get that data.
Let’s break down how each tool works and their impact on system performance.
Logs: Historical Records and Stored Data
Logs are your application’s running diary, providing a historical record of system behavior over time. They track events as they occur and store that information for later analysis. This makes them indispensable for identifying patterns, tracing event sequences, and diagnosing the root cause of failures.
However, logs come with a tradeoff: you must decide what to log ahead of time. Logging everything can quickly lead to performance hits and increased storage costs. When configured thoughtfully, though, logs provide the trail of breadcrumbs needed to troubleshoot even the most complex, distributed systems.
Live Breakpoints: Capturing State in Real Time
Live breakpoints take a different approach. Instead of relying on pre-defined log statements, they let you collect data on the fly without restarting or redeploying your application. You can set a breakpoint on any line of code and instantly capture the full state at that moment, including variable values, arguments, and the call stack.
Traditional breakpoints halt program execution, which isn’t feasible in production environments. Modern "non-breaking" breakpoints solve this problem. As Dynatrace puts it:
Using non-breaking breakpoints allows you to instantly see the complete state of your application, including stack trace, variable values, and more – all without stopping or breaking running code.
This feature is especially valuable when debugging third-party libraries like SpringBoot or ExpressJS, where adding custom log statements isn’t practical.
Performance Impact and System Load
Logs are always running, and every log statement adds to your system’s workload. High-volume logging can increase operational costs, reduce application throughput, and consume significant resources, including memory for buffers, disk space for storage, and CPU cycles for processing and transmitting logs.
Live breakpoints, by contrast, are selective and on-demand. They only activate on specific lines you target, allowing you to collect detailed snapshots without the constant overhead of logging. This efficiency is crucial in production environments where minimizing performance impact is a priority.
Choosing between logs and live breakpoints depends on your debugging needs and the demands of your system. Each tool brings its own strengths to the table, and understanding their differences helps you pick the right strategy for the job.
When to Use Logs
Logs serve as a historical record, offering insights into intermittent issues across services. They are invaluable for tracking transactions in distributed systems, pinpointing performance bottlenecks, and diagnosing problems that are difficult to replicate during development.
Here’s a closer look at when logs are most effective in production environments:
Low System Overhead at Scale
Logs can operate efficiently even under heavy traffic when configured thoughtfully. By default, setting log levels to Warning or Error ensures minimal system impact while still capturing critical information. During incidents, verbosity can be temporarily increased to identify issues more effectively. As highlighted in the Microsoft Code with Engineering Playbook:
Fine tune logging levels in production (>= warning for instance). During a new release the verbosity can be increased to facilitate bug identification.
This approach strikes a balance between maintaining performance and gathering detailed insights when needed, allowing logs to trace intricate event sequences without overloading the system.
Tracking Event Sequences
Logs are particularly useful for tracking the flow of events in distributed systems. In these environments, a single user request often interacts with multiple microservices. By implementing transaction IDs – unique identifiers generated at the entry point of a thread and appended to every log entry – you can create a clear path that spans nodes, asynchronous processes, and service boundaries. Peter Bourgon underscores the importance of focused logging:
Services should only log actionable information. That includes serious, panic-level errors that need to be consumed by humans, or structured data that needs to be consumed by machines.
This structured approach to logging makes it easier to detect intermittent issues, as logs continuously capture system behavior without compromising performance.
Adjusting Log Levels Without Restarts
One of the most powerful features of modern logging frameworks is the ability to adjust log verbosity on the fly. This flexibility is critical during active incidents when every moment matters. The Microsoft playbook emphasizes:
Ensure logging configuration can be modified without code changes. Ideally, make it changeable without application restarts.
This capability allows teams to temporarily increase log levels – for instance, setting them to DEBUG – to gather detailed information about an issue, and then revert to lower verbosity once the data is collected. Importantly, this can be done without interrupting application uptime. Tools like Fluent Bit or Logstash further enhance this process by offloading log processing from the application and providing a disk buffer during service disruptions.
When to Use Live Breakpoints
Live breakpoints are incredibly useful when you need to peek inside your code at a specific moment without halting its execution. Unlike traditional breakpoints – which pause everything and aren’t suitable for production environments – live breakpoints let your application keep running while capturing its state. As Dynatrace puts it:
Using non-breaking breakpoints allows you to instantly see the complete state of your application, including stack trace, variable values, and more – all without stopping or breaking running code.
This method grabs details like local variables, function arguments, and the full call stack at the exact moment a line of code executes. It gives you a clear view of what’s happening in your production environment without causing disruption.
Inspecting Code State in Real Time
Live breakpoints are perfect for capturing the exact state of your application during key moments. When triggered, they deliver a detailed snapshot of debug data, including all variable values and the full stack trace. You can even set conditional expressions, such as user_id == '12345', to gather data only when specific conditions are met. This is especially handy for troubleshooting issues tied to particular users or sessions.
Modern debugging tools also include performance safeguards. For example, they often set default limits, like allowing a maximum of 100 triggers or expiring after 7 days. You can also adjust the depth of data collection. A "Low" setting might capture 2 levels of nested objects and limit strings to 128 characters, while a "High" setting can go 5 levels deep and handle strings up to 4,096 characters.
This level of insight makes it easier to tackle persistent issues that demand precise, real-time data.
Debugging Consistent Issues
Live breakpoints are most effective for debugging bugs that occur consistently and require exact state information at specific moments. They’re particularly useful for addressing production-only issues that can’t be replicated in a local environment due to factors like high scalability, concurrent usage, or unpredictable behavior. For instance, if your HTTP server is returning empty JSON fields, live breakpoints let you examine variable values and code paths as the issue unfolds.
They’re also a game-changer for debugging third-party libraries where you don’t have access to the source code. By analyzing stack traces, you can pinpoint where external code interacts with your application. From there, you can set breakpoints at those interaction points using just the file name and line number.
Avoiding Redeployments
One of the standout benefits of live breakpoints is the ability to troubleshoot without modifying code or redeploying your application. You can add or remove breakpoints on the fly, capturing exactly the data you need without introducing new risks or waiting for CI/CD pipelines to run. This flexibility is crucial in environments where uptime is non-negotiable and stopping the application isn’t an option.
This approach is especially helpful for diagnosing tricky, hard-to-reproduce issues that require multiple iterations to fully understand. By eliminating the need for redeployments, live breakpoints save time and reduce the chances of introducing new problems while debugging.
Choosing Between Logs and Live Breakpoints
Picking between logs and live breakpoints really comes down to your system’s setup, the kind of issue you’re tackling, and how much detail you need. Logs are ideal for piecing together what happened over time, while live breakpoints shine when you need to see the exact state of your code as it runs. Think of logs as your first step in figuring out the "when" and "where" of a problem. If they don’t give you enough detail, that’s when live breakpoints come into play for a closer look. This methodical approach saves time and keeps you from diving too deep right away. Using logs to guide you can clarify when a live breakpoint is the next logical step.
Logs for Multi-Service Systems
In distributed systems, where requests pass through multiple services, logs are your go-to tool. Bugs that span multiple microservices require you to follow the entire chain of events rather than focus on individual snapshots. Structured logging, especially with correlation IDs, makes it easier to trace requests as they travel across services.
For serverless or cloud-based environments, where direct access to the host server is often unavailable, logs become your primary tool for understanding your infrastructure’s behavior.
Live Breakpoints for Targeted Debugging
Once logs lead you to a specific service or function, live breakpoints let you zoom in on the exact state of your code – using methods to debug production apps without redeploying. This is particularly helpful for debugging logic errors that are tough to replicate locally or for issues that only show up under production conditions. Live breakpoints can capture variable values, stack traces, and execution paths at the precise moment something goes wrong.
Using Logs and Live Breakpoints Together
Combining logs and live breakpoints can give you a well-rounded debugging strategy. Logs help you pinpoint the general problem area, while live breakpoints let you dig into the details to uncover the root cause. This approach avoids the tedious cycle of adding new logs, redeploying, and hoping you caught the right data.
For example, imagine your logs reveal that an API endpoint is returning empty JSON fields for specific user sessions. You could set a conditional live breakpoint (e.g., user_id == "12345") to capture the variable values and execution paths for that user without disrupting other traffic. This way, you use the historical context from logs alongside the real-time insights from live breakpoints to get a complete picture of the issue.
Logs vs. Live Breakpoints: Side-by-Side Comparison
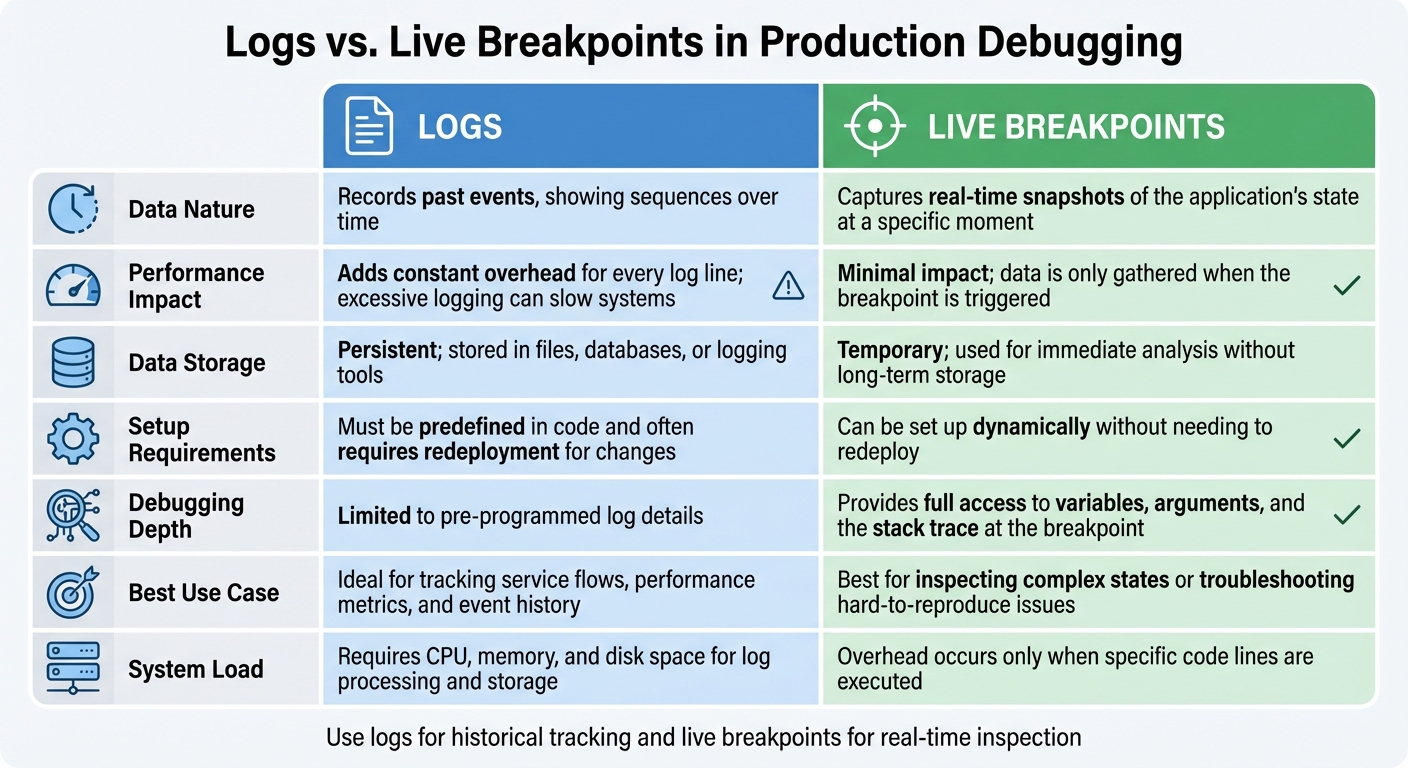
Logs vs Live Breakpoints: Production Debugging Comparison Chart
Here’s a quick reference to help you pick the right debugging tool: logs for understanding past events and live breakpoints for analyzing real-time application behavior.
Comparison Criteria
The table below highlights the main differences between these two approaches:
| Criteria | Logs | Live Breakpoints |
|---|---|---|
| Data Nature | Records past events, showing sequences over time | Captures real-time snapshots of the application’s state at a specific moment |
| Performance Impact | Adds constant overhead for every log line; excessive logging can slow systems | Minimal impact; data is only gathered when the breakpoint is triggered |
| Data Storage | Persistent; stored in files, databases, or logging tools (see more on the TraceKit Blog) | Temporary; used for immediate analysis without long-term storage |
| Setup Requirements | Must be predefined in code and often requires redeployment for changes | Can be set up dynamically without needing to redeploy |
| Debugging Depth | Limited to pre-programmed log details | Provides full access to variables, arguments, and the stack trace at the breakpoint |
| Best Use Case | Ideal for tracking service flows, performance metrics, and event history | Best for inspecting complex states or troubleshooting hard-to-reproduce issues |
| System Load | Requires CPU, memory, and disk space for log processing and storage | Overhead occurs only when specific code lines are executed |
Use this table as a handy guide to decide which tool fits your debugging needs in production environments.
Production Debugging Challenges
Debugging production systems is a high-stakes endeavor. You need to extract detailed information without jeopardizing the system’s performance, stability, or security. Unlike development environments, where you can freely pause code execution, production systems cater to live users who expect seamless service.
One of the biggest hurdles is system stability. Traditional debuggers halt code execution, which can freeze your application or cause timeouts. Henrik Warne highlights this risk:
Are you comfortable with attaching a debugger in a busy system carrying live traffic? There is always the possibility of making a mistake, or stopping threads that will cause time-outs in other parts of the system
.
Another major issue is performance overhead. Overusing DEBUG logging can drag down your application, increasing execution times and bloating data output. Maor Rudick from Rookout explains the delicate balance required:
Logging too much information will create an excess of information that will only make a developer’s job harder. On the other hand, logging too little may cause developers to miss pieces of information
. Live breakpoints offer a more efficient alternative, capturing data only when specific code lines execute, avoiding the constant noise of excessive logging.
Security and privacy bring additional challenges. Logs can inadvertently expose sensitive data if not properly filtered, and live breakpoints require stringent measures like authentication and data masking. Richard C. from Sentry warns of the risks:
The inspector has full access to Node and will run any dangerous code it’s given, including accessing your disk drive and sending information out to the internet. The inspector also accepts any debuggers that want to connect to it, with no authentication security
. To address these risks, logs must undergo proper PII scrubbing and secure transmission, while live breakpoints need robust access controls and masking techniques.
Finally, reproducibility remains a thorny issue. Some bugs only surface under specific conditions that are nearly impossible to replicate in staging environments. Known as "Heisenbugs", these elusive errors often disappear when you try to reproduce them locally. This makes tracking down and resolving production issues an even more complex task.
Conclusion
Logs and live breakpoints, as discussed earlier, work best when used together in production debugging. Tim Misiak, a Software Engineer, captures this balance perfectly:
Digging in with more heavyweight tools will always take more time, so it makes sense to solve as many problems as possible using lightweight techniques such as logging.
Start with logs to identify where issues are happening, and then turn to live breakpoints for deeper, more targeted insights. Logs provide the broader picture, while live breakpoints deliver the fine details, such as variable states and stack traces, to explain the root cause.
An efficient debugging process combines the strengths of both. Keep logging levels balanced to avoid overloading your system, and use live breakpoints selectively to avoid unnecessary redeployments. This dual approach ensures historical data from logs is paired with real-time clarity, making debugging faster and more reliable without compromising system performance.
FAQs
When should I use logs instead of live breakpoints for debugging in production?
Logs are perfect when you need a historical record of events that doesn’t disrupt the system. They provide a steady stream of information, capturing details like requests, errors, and timing data. This makes them incredibly helpful for diagnosing issues that have already happened or are tough to recreate. Plus, logs let you search through or replay past incidents, which can be a game-changer when dealing with rare or unpredictable bugs.
Unlike live breakpoints, logs don’t come with the risk of halting production code, which could slow down performance or even cause user-facing timeouts. This makes them especially handy in environments with high traffic or strict latency requirements where stopping services simply isn’t an option. Adding a log statement is also quick and straightforward – no complicated setup required – making it an excellent go-to for immediate debugging. Choose logs when you need safety, minimal disruption, and a clear historical view of your system’s behavior.
How do live breakpoints impact system performance compared to logging?
Live breakpoints are designed to have a minimal effect on system performance. They work by capturing data only when a specific line of code is executed, all without pausing the application or disrupting traffic. This makes them an efficient tool for real-time debugging in live production environments.
On the other hand, logging operates differently. It continuously writes messages to storage or external systems, which can demand significant CPU resources, I/O bandwidth, and disk space. Under heavy workloads, excessive logging can lead to increased latency or even system slowdowns. While both approaches serve important purposes, live breakpoints stand out as a lighter-weight solution, specifically built to reduce performance strain when diagnosing issues in active systems.
Is it possible to change logging levels without restarting my application?
The option to change logging levels without restarting your application hinges on how your logging system is set up. Some frameworks allow you to adjust logging levels dynamically, making it easier to tweak settings in real-time during debugging. If your setup doesn’t support this, though, you’ll likely need to restart the application to apply any changes. To know for sure, refer to the documentation for your specific logging framework.