Observability definition in modern software engineering: Observability is the ability to understand the internal state of a system by examining its external outputs—logs, metrics, and traces. Unlike traditional monitoring that tells you when something breaks, observability helps you understand why it broke and how to fix it. This comprehensive guide covers the observability definition, key differences from monitoring, implementation strategies, and how to achieve true observability with distributed tracing.
Table of Contents
- What Is Observability?
- The Three Pillars of Observability
- Monitoring vs Observability: Key Differences
- Why Observability Matters in 2025
- Implementing Observability with Distributed Tracing
- Getting Started with TraceKit
- Observability Best Practices
- Frequently Asked Questions
- Next Steps
What Is Observability?
The observability definition comes from control theory: a system is observable if you can determine its internal state by examining its external outputs. In software systems, this means understanding what’s happening inside your application by analyzing telemetry data it produces.
Traditional monitoring answers questions like “Is the server up?” or “Is CPU usage high?” Observability goes deeper, answering questions like:
- “Why did this specific user’s checkout fail?”
- “Which microservice caused the 2-second delay?”
- “What database queries are slowing down this endpoint?”
- “How does this error propagate across services?”
The key distinction in the observability definition is asking questions you didn’t anticipate. You don’t need to know what will break before it breaks.
The Three Pillars of Observability
Modern observability relies on three types of telemetry data, as defined by the OpenTelemetry observability primer:
1. Logs
Timestamped records of discrete events. Logs capture what happened at a specific moment:
2025-01-15 14:32:10 ERROR: Payment processing failed for order #12345
User ID: 789, Error: Gateway timeout after 30s
Best for: Debugging specific errors, audit trails, compliance
2. Metrics
Numerical measurements aggregated over time. Metrics show trends and patterns:
- Request rate: 1,240 requests/minute
- Error rate: 2.3%
- P95 latency: 450ms
- Database connection pool: 45/100 used
Best for: Dashboards, alerting, capacity planning
3. Traces
Records of requests as they flow through distributed systems. Traces show the complete journey of a single request across multiple services, databases, and external APIs.
Best for: Understanding system behavior, debugging production issues, identifying bottlenecks
While the traditional observability definition emphasizes all three pillars equally, distributed tracing has emerged as the most powerful tool for debugging modern microservices architectures.
Monitoring vs Observability: Key Differences
Understanding the observability definition requires distinguishing it from monitoring:
| Monitoring | Observability |
|---|---|
| Answers known questions | Answers unknown questions |
| “Is the server down?” | “Why did user #789’s request fail?” |
| Predefined dashboards and alerts | Ad-hoc exploration and investigation |
| Aggregated metrics | High-cardinality, granular data |
| Tells you what is broken | Tells you why it’s broken |
| Works for simple systems | Essential for distributed systems |
Example scenario: Your monitoring alerts you that API response time increased from 200ms to 800ms. That’s monitoring. Observability lets you trace a slow request to discover it’s caused by an N+1 query in your ORM that only triggers for users with more than 100 orders.
Why Observability Matters in 2025
The observability definition has become critical as systems have evolved:
1. Microservices Complexity
A single user request might touch 15+ services. Traditional monitoring can’t show you which service caused the problem or how the failure cascaded.
2. Cloud-Native Architectures
Containers, serverless functions, and auto-scaling make it impossible to predict where code will run. You need observability to understand ephemeral infrastructure.
3. Unknown Unknowns
You can’t write alerts for problems you haven’t imagined. According to Google’s SRE book, the most critical production issues are often ones you never anticipated.
4. Faster Debugging
Mean time to resolution (MTTR) drops dramatically when you can see the complete context of a failure instead of piecing together logs from multiple systems.
Implementing Observability with Distributed Tracing
The most effective way to achieve the observability definition in practice is through distributed tracing. Here’s how it works:
How Distributed Tracing Works
When a request enters your system, it receives a unique trace ID. As the request flows through services, each operation creates a span with timing data, metadata, and context. All spans share the same trace ID, allowing you to reconstruct the complete request flow.
What You Can See with Tracing
- Request waterfall: Visual timeline showing which operations happened when and how long they took
- Service dependencies: Which services talk to each other
- Bottlenecks: Exactly which operation is slow (database query, external API, etc.)
- Error context: Complete state when an error occurred, including user ID, request parameters, and upstream operations
- Database queries: Actual SQL with bindings and execution time
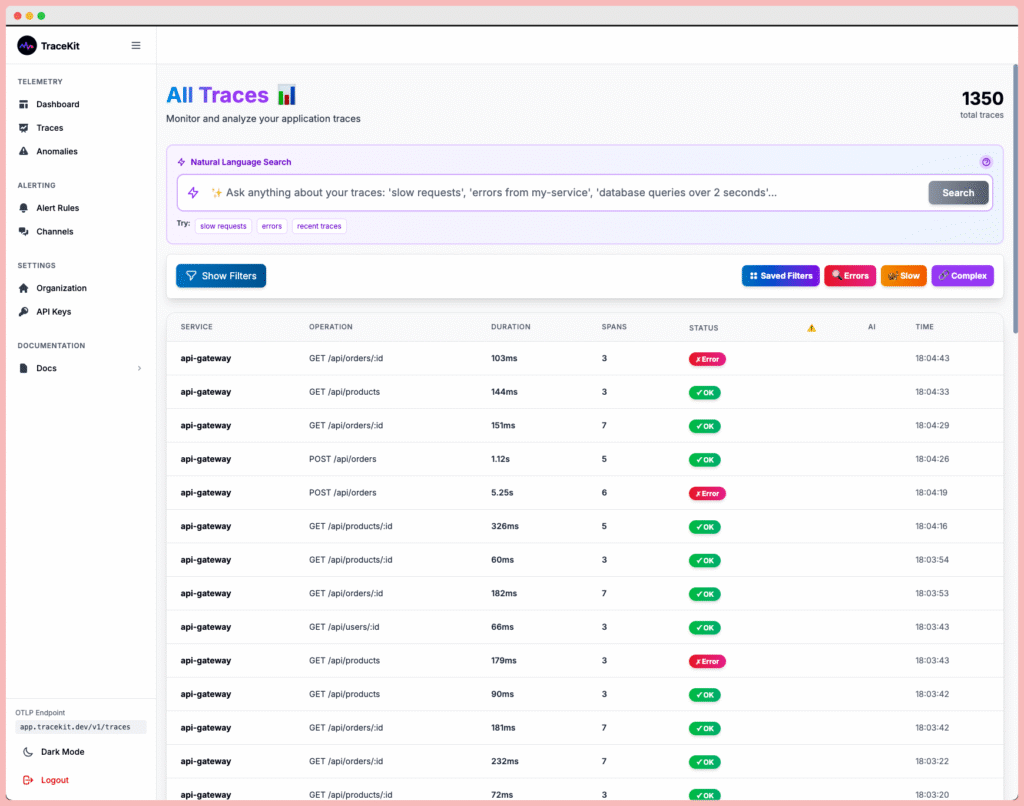
Getting Started with TraceKit
TraceKit makes implementing the observability definition simple with automatic instrumentation. Here’s how to add distributed tracing to your applications:
Laravel Example
Install the TraceKit Laravel package:
composer require tracekit/laravel-apmAdd your API key to .env:
TRACEKIT_API_KEY=your_api_key_here
TRACEKIT_SERVICE_NAME=my-laravel-app
That’s it! TraceKit automatically traces:
- ✓ HTTP requests with route, method, status, and duration
- ✓ Database queries with SQL, bindings, and timing
- ✓ Queue jobs with payload and status
- ✓ Cache operations
- ✓ Exceptions with full stack traces
Node.js/Express Example
Install the TraceKit Node APM package:
npm install @tracekit/node-apmInitialize at the top of your main file:
const tracekit = require('@tracekit/node-apm');

tracekit.init({
  apiKey: 'your_api_key_here',
  serviceName: 'my-node-api'
});

const express = require('express');
const app = express();

// Your routes automatically traced
app.get('/api/users/:id', async (req, res) => {
  const user = await db.users.findById(req.params.id);
  res.json(user);
});
TraceKit uses OpenTelemetry, the vendor-neutral standard for observability, so you’re never locked in.
What You Get
With TraceKit, you achieve the full observability definition:
- Zero-config automatic tracing: No manual instrumentation required
- Request-based pricing: Pay for what you use, not per host
- Beautiful UI: Intuitive trace visualization with dark mode
- Intelligent alerting: Get notified via Slack or Telegram when things break
- Code-level debugging: Set breakpoints and inspect variables in production
TraceKit costs 1/10th of Datadog or New Relic while providing the same observability capabilities.
Observability Best Practices
1. Start with Distributed Tracing
Of the three pillars, tracing provides the most value for debugging. Start here before investing in complex metrics dashboards.
2. Use OpenTelemetry
Avoid vendor lock-in by using the industry-standard OpenTelemetry protocol. You can switch observability platforms without changing your instrumentation.
3. Add Context to Spans
Include business context like user IDs, tenant IDs, feature flags, and A/B test variants. This makes traces searchable and debuggable.
4. Trace Errors with Full Context
When exceptions occur, ensure your observability tool captures the complete trace leading to the error, not just the error message.
5. Monitor What Matters
Focus on user-facing metrics like request latency and error rates. Internal metrics like CPU usage matter less than user experience.
6. Keep Costs Predictable
Choose observability tools with transparent, usage-based pricing. Host-based pricing can spiral as you scale.
Frequently Asked Questions
What is the observability definition in simple terms?
The observability definition in simple terms: observability is the ability to understand what’s happening inside your software system by looking at its outputs (logs, metrics, traces). It’s like having X-ray vision into your application so you can debug issues you didn’t predict. Unlike monitoring which tells you what broke, observability tells you why it broke.
How is observability different from monitoring?
Monitoring answers predefined questions using dashboards and alerts (“Is the server up?”). Observability lets you ask new questions about your system’s behavior without setting up monitoring in advance (“Why did this specific user’s request fail?”). Monitoring works for known failure modes; observability handles unknown problems in complex distributed systems.
What are the three pillars of observability?
The three pillars of observability are logs (timestamped event records), metrics (numerical measurements over time), and traces (request flows through distributed systems). While all three are valuable, distributed tracing has become the most critical pillar for debugging modern microservices architectures because it shows the complete context of how requests flow through your system.
Do I need observability if I already have monitoring?
Yes, if you run microservices or distributed systems. Traditional monitoring tells you that something is wrong, but observability tells you why and where. For example, monitoring might alert you to increased latency, but observability lets you trace a slow request to discover it’s caused by a specific database query that only triggers under certain conditions.
What is the best way to implement observability?
The most effective way to implement observability is through distributed tracing using OpenTelemetry, the industry standard. Tools like TraceKit provide automatic instrumentation for popular frameworks (Laravel, Node.js, Express), so you get zero-config tracing of HTTP requests, database queries, and errors. Start with tracing first, then add custom metrics and structured logging as needed.
How much does observability cost?
Observability costs vary widely by vendor. Traditional APM tools like Datadog charge $31+ per host per month, which can reach $50,000+/year for growing companies. Modern alternatives like TraceKit use request-based pricing at 1/10th the cost while providing the same observability capabilities. Choose tools with transparent, predictable pricing that scales with your usage, not your infrastructure.
Can I achieve observability with open-source tools?
Yes, you can self-host open-source tools like Jaeger, Grafana, and Prometheus to achieve observability. However, this requires dedicated engineers to maintain the infrastructure, configure storage, and manage scaling. Managed observability platforms like TraceKit provide the same OpenTelemetry-based tracing without the operational overhead, often at lower total cost than self-hosting.
Next Steps
Ready to implement observability in your applications? TraceKit makes it easy to achieve the full observability definition with zero-config distributed tracing:
- Start your free TraceKit trial
- Read the TraceKit documentation – Integration guides for Laravel, Node.js, and more
- Laravel observability guide – Zero-config tracing for Laravel apps
- Node.js observability guide – Automatic tracing for Express and NestJS
TraceKit provides enterprise-grade observability at 1/10th the cost of Datadog or New Relic. Get the visibility you need without the massive bill.