Node.js monitoring is essential for maintaining healthy production applications: Track performance bottlenecks, debug errors faster, and understand how requests flow through your services. This comprehensive guide covers everything you need to implement effective Node.js monitoring in 2025, including automatic instrumentation, distributed tracing, and best practices for Express and NestJS applications.
Table of Contents
- Why Node.js Monitoring Matters
- What to Monitor in Node.js Applications
- Monitoring Approaches: Manual vs Automatic
- Setting Up Node.js Monitoring with TraceKit
- Express.js Monitoring Setup
- NestJS Monitoring Setup
- Node.js Monitoring Best Practices
- Common Performance Issues to Monitor
- Frequently Asked Questions
- Next Steps
Why Node.js Monitoring Matters
Node.js applications are inherently asynchronous and event-driven, making them challenging to debug in production. Without proper monitoring, you’re flying blind when issues occur.
Here’s what happens without monitoring:
- Mystery slowdowns: Users complain about slow responses, but you can’t identify which endpoint or database query is the culprit
- Silent failures: Errors occur in background jobs or async operations, but you never know until users report issues
- Resource leaks: Memory leaks or connection pool exhaustion gradually degrade performance
- Cascading failures: One slow service impacts others, but you can’t trace the root cause
Effective Node.js monitoring solves these problems by providing visibility into request flows, performance metrics, and error context.
What to Monitor in Node.js Applications
Modern Node.js monitoring should capture multiple layers of your application:
1. HTTP Request Metrics
- Response times (p50, p95, p99 percentiles)
- Request throughput (requests per second)
- Status code distribution (2xx, 4xx, 5xx)
- Route-level performance breakdown
2. Application Performance
- Database query duration and frequency
- External API call latency
- Cache hit/miss rates
- Custom business logic timing
3. Error Tracking
- Exception types and messages
- Stack traces with source context
- Error frequency and patterns
- Request context when errors occur
4. System Resources
- Memory usage and garbage collection
- CPU utilization
- Event loop lag
- Active connection counts
According to Node.js performance best practices, monitoring these metrics helps identify bottlenecks before they impact users.
Monitoring Approaches: Manual vs Automatic
There are two main approaches to instrumenting Node.js applications:
Manual Instrumentation
You add monitoring code throughout your application:
const startTime = Date.now();
// Your code here
const duration = Date.now() - startTime;
logger.info(`Operation took ${duration}ms`);Pros: Full control, custom metrics
Cons: Time-consuming, error-prone, maintenance burden
Automatic Instrumentation (Recommended)
A monitoring agent automatically captures telemetry using OpenTelemetry, the industry standard for observability:
// One-line setup, automatic tracing
require('@tracekit/node-apm');Pros: Zero code changes, instant visibility, standardized
Cons: Less control over custom metrics (though still supported)
For production applications, automatic instrumentation is the clear winner. It provides comprehensive Node.js monitoring without cluttering your codebase.
Setting Up Node.js Monitoring with TraceKit
TraceKit provides automatic Node.js monitoring at a fraction of the cost of Datadog or New Relic. Here’s how to get started:
Step 1: Install the Package
npm install @tracekit/node-apm
# or
yarn add @tracekit/node-apm
Step 2: Configure Environment Variables
Create a .env file with your TraceKit API key:
TRACEKIT_API_KEY=your_api_key_here
TRACEKIT_SERVICE_NAME=my-nodejs-api
TRACEKIT_ENVIRONMENT=production
Generate your API key from the TraceKit API Keys page.
Step 3: Initialize at Application Start
The TraceKit agent must be initialized before any other imports:
// index.js - FIRST LINE
require('@tracekit/node-apm');

// Now import your application code
const express = require('express');
const app = express();

// Your routes and middleware...
app.listen(3000);
That’s it! Your Node.js application now sends traces to TraceKit automatically.
Express.js Monitoring Setup
For Express applications, TraceKit automatically instruments:
- All HTTP routes and middleware
- Request/response timing
- Status codes and errors
- Query parameters and headers
Complete Express Example
// server.js
require('@tracekit/node-apm');
const express = require('express');
const app = express();
app.get('/api/users/:id', async (req, res) => {
// This entire request is automatically traced
const user = await db.query('SELECT * FROM users WHERE id = ?', [req.params.id]);
res.json(user);
});
app.listen(3000, () => {
console.log('Server running with monitoring enabled');
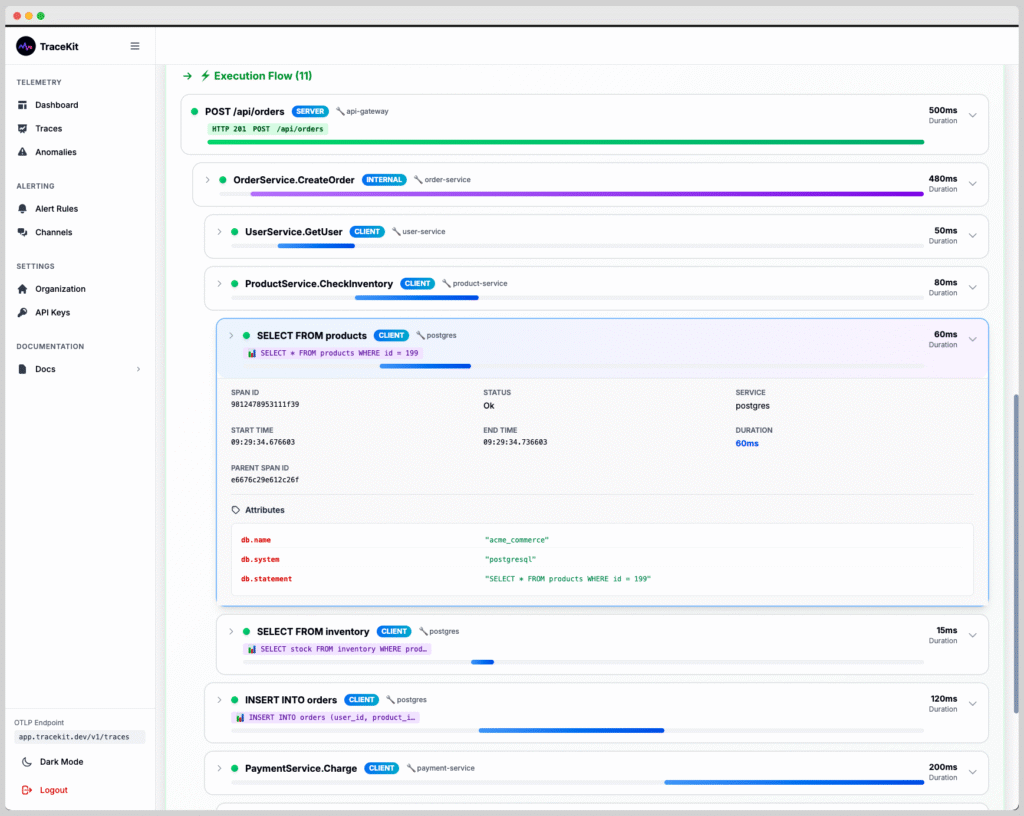
});Every request to /api/users/:id creates a distributed trace showing:
- Total request duration
- Database query time
- Response size
- Any errors that occurred
NestJS Monitoring Setup
NestJS applications work the same way. Initialize TraceKit in your main.ts file:
// main.ts - FIRST LINE
import '@tracekit/node-apm';

import { NestFactory } from '@nestjs/core';
import { AppModule } from './app.module';

async function bootstrap() {
  const app = await NestFactory.create(AppModule);
  await app.listen(3000);
}
bootstrap();
TraceKit automatically traces:
- Controllers and route handlers
- Guards and interceptors
- Exception filters
- Dependency injection resolution
Node.js Monitoring Best Practices
1. Set Meaningful Service Names
Use descriptive service names in distributed systems:
TRACEKIT_SERVICE_NAME=user-api
TRACEKIT_SERVICE_NAME=payment-service
TRACEKIT_SERVICE_NAME=notification-worker
2. Tag Traces with Context
Add custom attributes to traces for better filtering:
const { trace } = require('@opentelemetry/api');

const span = trace.getActiveSpan();
span?.setAttribute('user.id', userId);
span?.setAttribute('tenant.id', tenantId);
3. Monitor Async Operations
Node.js monitoring must handle asynchronous code properly. TraceKit automatically maintains trace context across async boundaries:
app.get('/api/data', async (req, res) => {
  // All these async calls are traced together
  const [users, posts, comments] = await Promise.all([
    fetchUsers(),
    fetchPosts(),
    fetchComments()
  ]);
  res.json({ users, posts, comments });
});
4. Set Appropriate Sample Rates
For high-traffic applications, sample traces to control costs:
TRACEKIT_SAMPLE_RATE=0.1 # Trace 10% of requests5. Monitor Different Environments Separately
Use environment tags to separate staging from production:
TRACEKIT_ENVIRONMENT=production
TRACEKIT_ENVIRONMENT=staging
TRACEKIT_ENVIRONMENT=development
Common Performance Issues to Monitor
Here are the most common Node.js performance issues that monitoring helps identify:
1. N+1 Query Problems
Making database queries in loops destroys performance. Node.js monitoring reveals these patterns:
// BAD: N+1 queries (shows as many DB spans in trace)
for (const user of users) {
  user.posts = await db.query('SELECT * FROM posts WHERE user_id = ?', [user.id]);
}

// GOOD: Single query (shows as one DB span)
const posts = await db.query('SELECT * FROM posts WHERE user_id IN (?)', [userIds]);
2. Blocking Event Loop
CPU-intensive operations block the event loop. Monitor event loop lag to detect this:
// Avoid synchronous operations in request handlers
app.get('/process', (req, res) => {
  // BAD: Blocks event loop
  const result = heavyComputation();

  // GOOD: Use worker threads or async processing
  processQueue.add({ data: req.body });
});
3. Memory Leaks
Monitor memory trends over time. Steady growth indicates leaks:
- Unclosed database connections
- Event listeners not removed
- Large objects in closures
- Cache without size limits
4. Unhandled Promise Rejections
These crash Node.js applications. Monitoring catches them:
process.on('unhandledRejection', (reason, promise) => {
  // TraceKit automatically captures these
  console.error('Unhandled Rejection:', reason);
});
Learn more about handling unhandled rejections in the Node.js documentation.
Frequently Asked Questions
What is Node.js monitoring and why do I need it?
Node.js monitoring is the practice of tracking your application’s performance, errors, and resource usage in production. You need it because Node.js applications are asynchronous and event-driven, making issues difficult to debug without visibility into request flows, timing data, and error context. Monitoring helps you identify bottlenecks, catch errors before users report them, and understand how your services interact.
Does Node.js monitoring impact application performance?
Modern monitoring solutions like TraceKit use OpenTelemetry with minimal overhead (typically less than 5% CPU and memory). The automatic instrumentation is optimized to avoid blocking the event loop. The performance insights you gain far outweigh the small overhead. You can also use sampling to reduce overhead in high-traffic applications.
How is TraceKit different from Datadog or New Relic for Node.js monitoring?
TraceKit provides the same automatic Node.js monitoring capabilities as Datadog and New Relic but at 1/10th the cost. Instead of charging per host (which gets expensive with containers), TraceKit uses request-based pricing. All three use OpenTelemetry for instrumentation, so you get the same trace quality. TraceKit is ideal for startups and scale-ups who need production-grade monitoring without enterprise pricing.
Can I use Node.js monitoring with TypeScript applications?
Yes, TraceKit’s Node.js monitoring package provides first-class TypeScript support. The package includes TypeScript definitions and works seamlessly with TypeScript projects. Simply import the package at the top of your main TypeScript file before other imports, and compilation works as expected. All automatic instrumentation works identically in TypeScript and JavaScript applications.
What’s the best way to monitor microservices in Node.js?
Use distributed tracing to monitor Node.js microservices. Each service should initialize TraceKit with a unique service name. When services call each other, trace context propagates automatically through HTTP headers, allowing you to see the complete request flow across all services. This reveals which service is slow, where errors originate, and how services depend on each other. Set up different API keys per environment to keep staging and production traces separate.
How do I monitor database queries in Node.js applications?
TraceKit automatically instruments popular Node.js database libraries including PostgreSQL (pg), MySQL (mysql2), MongoDB, and Redis. Each query appears as a span in your traces showing the SQL/query text, duration, and connection details. This helps identify slow queries, N+1 query problems, and database bottlenecks. No manual instrumentation is required—just install the monitoring package and queries are traced automatically.
Can I add custom metrics to Node.js monitoring?
Yes, you can add custom spans and attributes to track business-specific metrics. Use the OpenTelemetry API to create custom spans for critical operations, add attributes for user IDs or tenant IDs, and record custom metrics like payment amounts or feature usage. This combines application performance monitoring with business metrics in a single view, helping you understand both technical and business impact of issues.
Next Steps
Ready to implement Node.js monitoring in your application?
- Start your free TraceKit trial
- Read the Node.js integration docs – Complete setup guide with TypeScript examples
- Explore TraceKit documentation – Learn about alerting, team features, and advanced configuration
With TraceKit’s automatic instrumentation, you can have production-grade Node.js monitoring running in under 10 minutes. Start tracking performance, debugging issues faster, and understanding your application’s behavior in production today.