Live Breakpoints vs. Traditional Debugging
Live breakpoints vs traditional debugging compared. When to use each for production issues, with side-by-side feature and performance analysis.

Debugging production issues can be challenging, especially when traditional methods require stopping applications or redeploying code. Live breakpoints offer a modern solution by allowing developers to collect debugging data without disrupting application performance. Here's how the two approaches compare:
- Traditional Debugging: Pauses program execution, ideal for local environments but impractical for live systems. Requires redeployments for updates and can introduce delays.
- Live Breakpoints: Operates without halting the application, capturing snapshots of the system's state in production. No redeployment is needed, and it minimizes performance impact.
Quick Comparison:
| Feature | Traditional Debugging | Live Breakpoints |
|---|---|---|
| Execution | Stops application | Runs uninterrupted |
| Deployment | Requires redeployment | No redeployment needed |
| Performance Impact | High overhead | Minimal impact |
| Production Suitability | Limited | Designed for live environments |
| Security | Requires admin access | Uses secure outbound connections |
For live systems, live breakpoints are a practical choice, offering faster issue resolution and reduced downtime. Tools like TraceKit simplify this process, making debugging in production more efficient and secure.
Live Breakpoints vs Traditional Debugging: Feature Comparison
Traditional Debugging Explained
How Traditional Debugging Works
Traditional step debugging involves an interactive approach where developers examine code line by line to understand data structures and control flow. The process revolves around setting breakpoints - specific lines in the code where program execution pauses. Once paused, developers can inspect the current state of the application in detail.
To navigate through the code, developers use commands like Step Over, Step Into, Step Out, and Resume. These tools allow them to explore the call stack, check variable values, and evaluate expressions. While debugging locally is relatively simple, remote debugging introduces extra hurdles, such as configuring network access and setting up the environment.
Although this method works well in controlled scenarios, it faces serious limitations when applied to live production environments.
Production Debugging Challenges
Traditional step debugging becomes problematic in production because it relies on pausing program execution - something that's not feasible when real users are interacting with the system. As the Node.js documentation explains:
"Using the live debugger in production is usually not an option as we have limited access to the machine and we cannot interrupt the execution of the application as it handles a business-critical workload."
When logs don’t provide enough information, engineers often resort to adding new log statements, which requires waiting for a fresh deployment cycle to gather the needed data. The challenge grows when bugs only appear in production due to specific data conditions or the scale of operations, making them almost impossible to replicate locally.
Traditional debugging tools, originally designed for local development, struggle to handle the complexity of modern cloud-native environments. This inefficiency not only slows down the debugging process but also diverts engineers from focusing on delivering new features, consuming valuable time in the process.
Real-Time Debugging of Kubernetes Applications in Production
What Are Live Breakpoints?
Live breakpoints let you capture the state of your application as it runs - without pausing its execution. They gather details like local variables, stack traces, and heap data at the exact moment a specific line of code is hit, all while the application continues running at full speed.
Unlike traditional breakpoints that halt the program, live breakpoints take a snapshot of debugging data and send it to your IDE or management console. This happens in real time, so you can keep interacting with the application without interruption.
How Live Breakpoints Work
Live breakpoints rely on bytecode manipulation or specialized agents to inject data collection instructions into the running code. Here’s the beauty of it: you don’t need to modify the code or redeploy the application.
When you set a live breakpoint - using your IDE or a web interface - a production agent dynamically captures the state of the application when that line of code is executed. To avoid slowing down performance, these tools come with built-in safeguards to ensure data collection doesn’t overburden the CPU.
You can also fine-tune how much data is captured by adjusting the collection levels. For example, Dynatrace offers three settings:
- Low: Captures data two levels deep with strings up to 128 characters.
- Medium: Captures data five levels deep with strings up to 512 characters.
- High: Captures data eight levels deep with strings up to 4,096 characters.
This flexible approach gives you real-time debugging insights without disrupting the application’s normal operations.
Benefits of Live Breakpoints
The standout advantage of live breakpoints is that they eliminate downtime. Your application keeps running smoothly, even as you gather the data needed to fix bugs. There’s no need to add extra log statements, wait for CI/CD pipelines, or redeploy the code.
Live breakpoints are particularly effective in distributed systems, where traditional debuggers often fall short. They’re built for modern environments like cloud-native applications and Kubernetes, offering visibility across multiple services and instances. You can even debug third-party libraries, such as Apache Tomcat or SpringBoot, without needing the source code on hand.
Another major perk is conditional data collection. You can set parameters (e.g., user_id == '12345') so snapshots are only triggered under specific conditions. This targeted approach cuts through the noise, making it easier to identify the exact scenarios causing issues in production.
Key Differences Between the Two Approaches
The divide between traditional debugging and live breakpoints becomes especially clear when you consider how each operates in production environments. Traditional debugging involves pausing execution to examine the application's behavior - an impractical option when users are actively relying on your service. In contrast, live breakpoints capture snapshots of the application's state without halting its execution, allowing you to investigate problems while the system continues running as usual. This fundamental difference is crucial when assessing performance and security in production settings.
Performance is another area where the two approaches diverge significantly. For instance, setting a method-level breakpoint in a traditional Java debugger can slow execution time from 4.5 to 47 seconds - a tenfold increase. Moreover, traditional remote debugging often struggles with network latency, leading to timeouts when the connection between your local machine and the production server is unstable. Live breakpoints sidestep these issues by capturing and analyzing snapshots after execution, eliminating delays.
"Live debuggers fetch the code, but don't run it. Latency is eliminated from the equation here, as the debug only begins after fetching the code." - Ismail Egilmez, Business Development Specialist
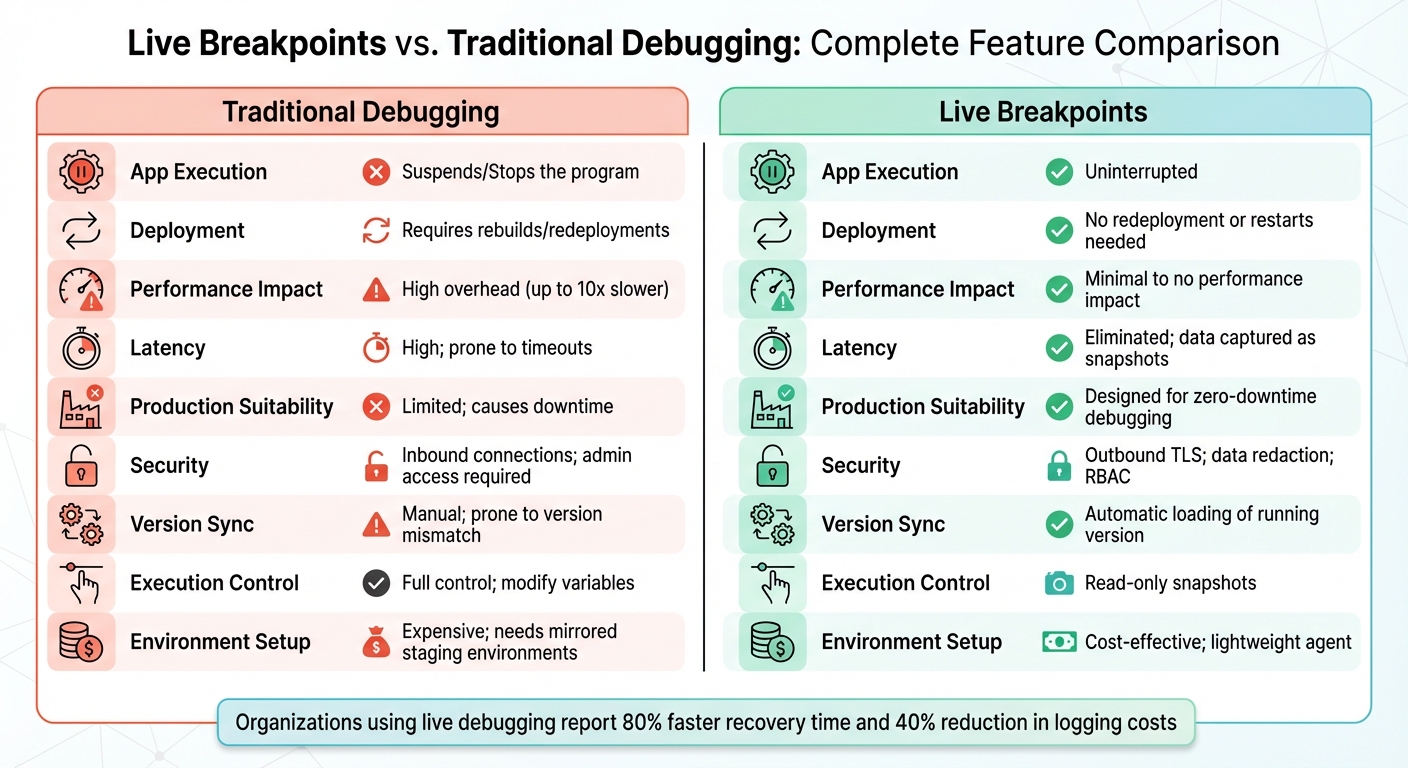
Comparison Table: Live Breakpoints vs. Traditional Debugging
| Feature | Traditional Debugging | Live Breakpoints |
|---|---|---|
| App Execution | Suspends/Stops the program | Uninterrupted |
| Deployment | Requires rebuilds/redeployments | No redeployment or restarts needed |
| Latency | High; prone to timeouts | Eliminated; data captured as snapshots |
| Security | Inbound connections; admin access required | Outbound TLS; data redaction; RBAC |
| Version Sync | Manual; prone to version mismatch | Automatic loading of running version |
| Performance | Significant overhead (up to 10x slower) | Minimal to no performance impact |
How These Differences Affect Production Debugging
For teams managing distributed systems, these differences directly influence how quickly production issues can be resolved. As noted earlier, production debugging requires minimal disruption to the application. Live breakpoints meet this need by enabling on-demand data collection without altering code or redeploying. On the other hand, traditional debugging often involves code changes and redeployments, which can extend the time required to fix issues.
Organizations leveraging dynamic logs report an 80% faster recovery time for production issues and save 40% on logging costs by avoiding the "log everything just in case" method. Additionally, automatic version syncing ensures you're debugging the exact version running in production, avoiding the common problem of mismatched code versions.
Security is another critical factor. Traditional debugging typically requires admin-level access and inbound connections, which can increase the system's vulnerability. In contrast, dynamic logs uses encrypted outbound connections and includes features like data redaction to safeguard sensitive information. This makes it a safer choice for production environments, especially where security teams are cautious about granting broad access.
Up next, we’ll explore the pros and cons of each approach to help your team make an informed decision.
Pros and Cons of Each Approach
Both debugging methods come with their own set of trade-offs, which can significantly impact production workflows. Traditional debugging offers the ability to inspect code line-by-line and modify variables as needed. This makes it a go-to choice for local development, where pausing the application isn't a concern. However, this same level of control becomes a drawback in production environments. The "Halt-Inspect-Resume" workflow can disrupt critical operations and requires administrator-level access, which adds complexity and risk.
On the other hand, live breakpoints are specifically designed for production environments. They follow an "Inject-Gather-Observe" process, allowing developers to capture snapshots of the application state without halting its execution. The trade-off? You're limited to read-only data, meaning you can't modify variables or interactively step through the code.
"Dynamic logs allows developers to be connected to their live applications to perform an on-the-spot root cause analysis without the operational overheads of recreating the testing environment." - Eran Kinsbruner, Lightrun
Comparison Table: Advantages and Disadvantages
| Feature | Traditional Debugging | Live Breakpoints |
|---|---|---|
| Execution Control | Full control; modify variables and step through code | Read-only snapshots; observation only |
| Production Use | Limited; causes downtime and needs admin access | High; designed for zero-downtime debugging |
| Security | High risk; requires inbound connections and admin privileges | Lower risk; uses outbound TLS and PII redaction |
| Environment Setup | Expensive; needs mirrored staging environments | Cost-effective; lightweight agent, no redeploys |
| Latency | High; prone to network timeouts | Minimal; data fetched as snapshots |
| Code Editing | Allows real-time code modification | Does not support code changes |
This table highlights how each method aligns with different use cases, making it easier to decide which fits your team’s needs.
Choosing the Right Approach for Your Team
The choice between these debugging methods depends on factors like team size, budget, and the complexity of your systems. For small teams or startups, live breakpoints can be a game-changer. They eliminate the need for costly, mirrored staging environments and help avoid the "logging FOMO" trap - where teams over-log data to ensure nothing is missed.
Traditional debugging still holds its ground for local development and training purposes. It’s particularly helpful for novice developers, as stepping through code line-by-line provides a clearer understanding of how the application behaves. This method is also ideal when experimenting with fixes before deploying them to production.
For complex, distributed systems - like those running on Kubernetes or serverless platforms - live breakpoints shine. They bypass the time-consuming process of rebuilding Docker images and redeploying applications.
From a security perspective, dynamic logs are often preferred because it uses outbound connections and avoids storing source code on external servers. However, safeguards like rate-limiting and hit limits are essential to prevent performance issues in high-traffic areas of the application. In contrast, traditional debugging’s requirement for administrator access and inbound ports makes it less appealing in security-conscious production environments.
When to Use Live Breakpoints
Live breakpoints aren’t a one-size-fits-all solution, but they shine in specific scenarios. In distributed systems, serverless functions, and production environments where traditional debugging methods could lead to downtime, live breakpoints prove to be an invaluable tool. They allow developers to debug in real-time without interrupting the running application.
Key Use Cases for Live Breakpoints
Distributed and serverless architectures are a prime example of where live breakpoints excel. If your code runs on platforms like AWS Lambda or spans multiple microservices, replicating the environment locally can be nearly impossible. With live breakpoints, you can collect data directly from the live system, bypassing the need for local replication.
Production-only bugs often arise because production environments differ significantly from QA or development setups. These bugs can be tricky to reproduce locally, especially when sensitive data is involved. Live breakpoints let you debug using actual production data, avoiding the risks of copying sensitive information to a local machine.
High-concurrency issues are among the hardest problems to diagnose. These bugs typically surface only under heavy traffic or load, making local reproduction unfeasible. Live breakpoints help by capturing the system’s state during peak activity, giving you a clear view of how the application behaves under real-world conditions.
Third-party dependencies and legacy code can also benefit from live breakpoints. When problems occur in external libraries or older codebases where adding logs is difficult - or even impossible - live breakpoints provide visibility into these components at runtime.
"The sooner you find the root of the problem, the faster it can be resolved. Being able to identify and fix a problem while the application is in production without having to reproduce the error locally is a great advantage in terms of velocity." - Maor Rudick, Rookout
Unlike traditional breakpoints, which halt the entire application, live breakpoints let the system continue running while you inspect the issue. This non-intrusive approach makes them particularly useful in production environments.
Benefits for Small Teams and Startups
Live breakpoints don’t just offer technical advantages - they also provide strategic value, especially for lean teams. For startups and smaller teams, live breakpoints address a critical resource challenge that traditional debugging methods struggle to solve. Maintaining a staging environment that mirrors production is both complex and expensive. Live breakpoints eliminate this requirement by enabling you to observe code behavior directly in production, saving time and resources.
Additionally, on-demand data collection reduces storage and maintenance costs. Instead of generating and managing massive logs, live breakpoints capture only the essential data you need. This minimizes the engineering effort required for log cleanup and retention policies.
"By shifting their logging mindset to Dynamic Logs, teams can reduce logging costs and, most importantly, the heavy effort required to support intense logging pipelines and cleanups." - Dynatrace
For new developers, live breakpoints can simplify onboarding. Observing production code behavior in real-time provides valuable snapshots, making troubleshooting faster and more intuitive.
Live Breakpoints in Practice with TraceKit
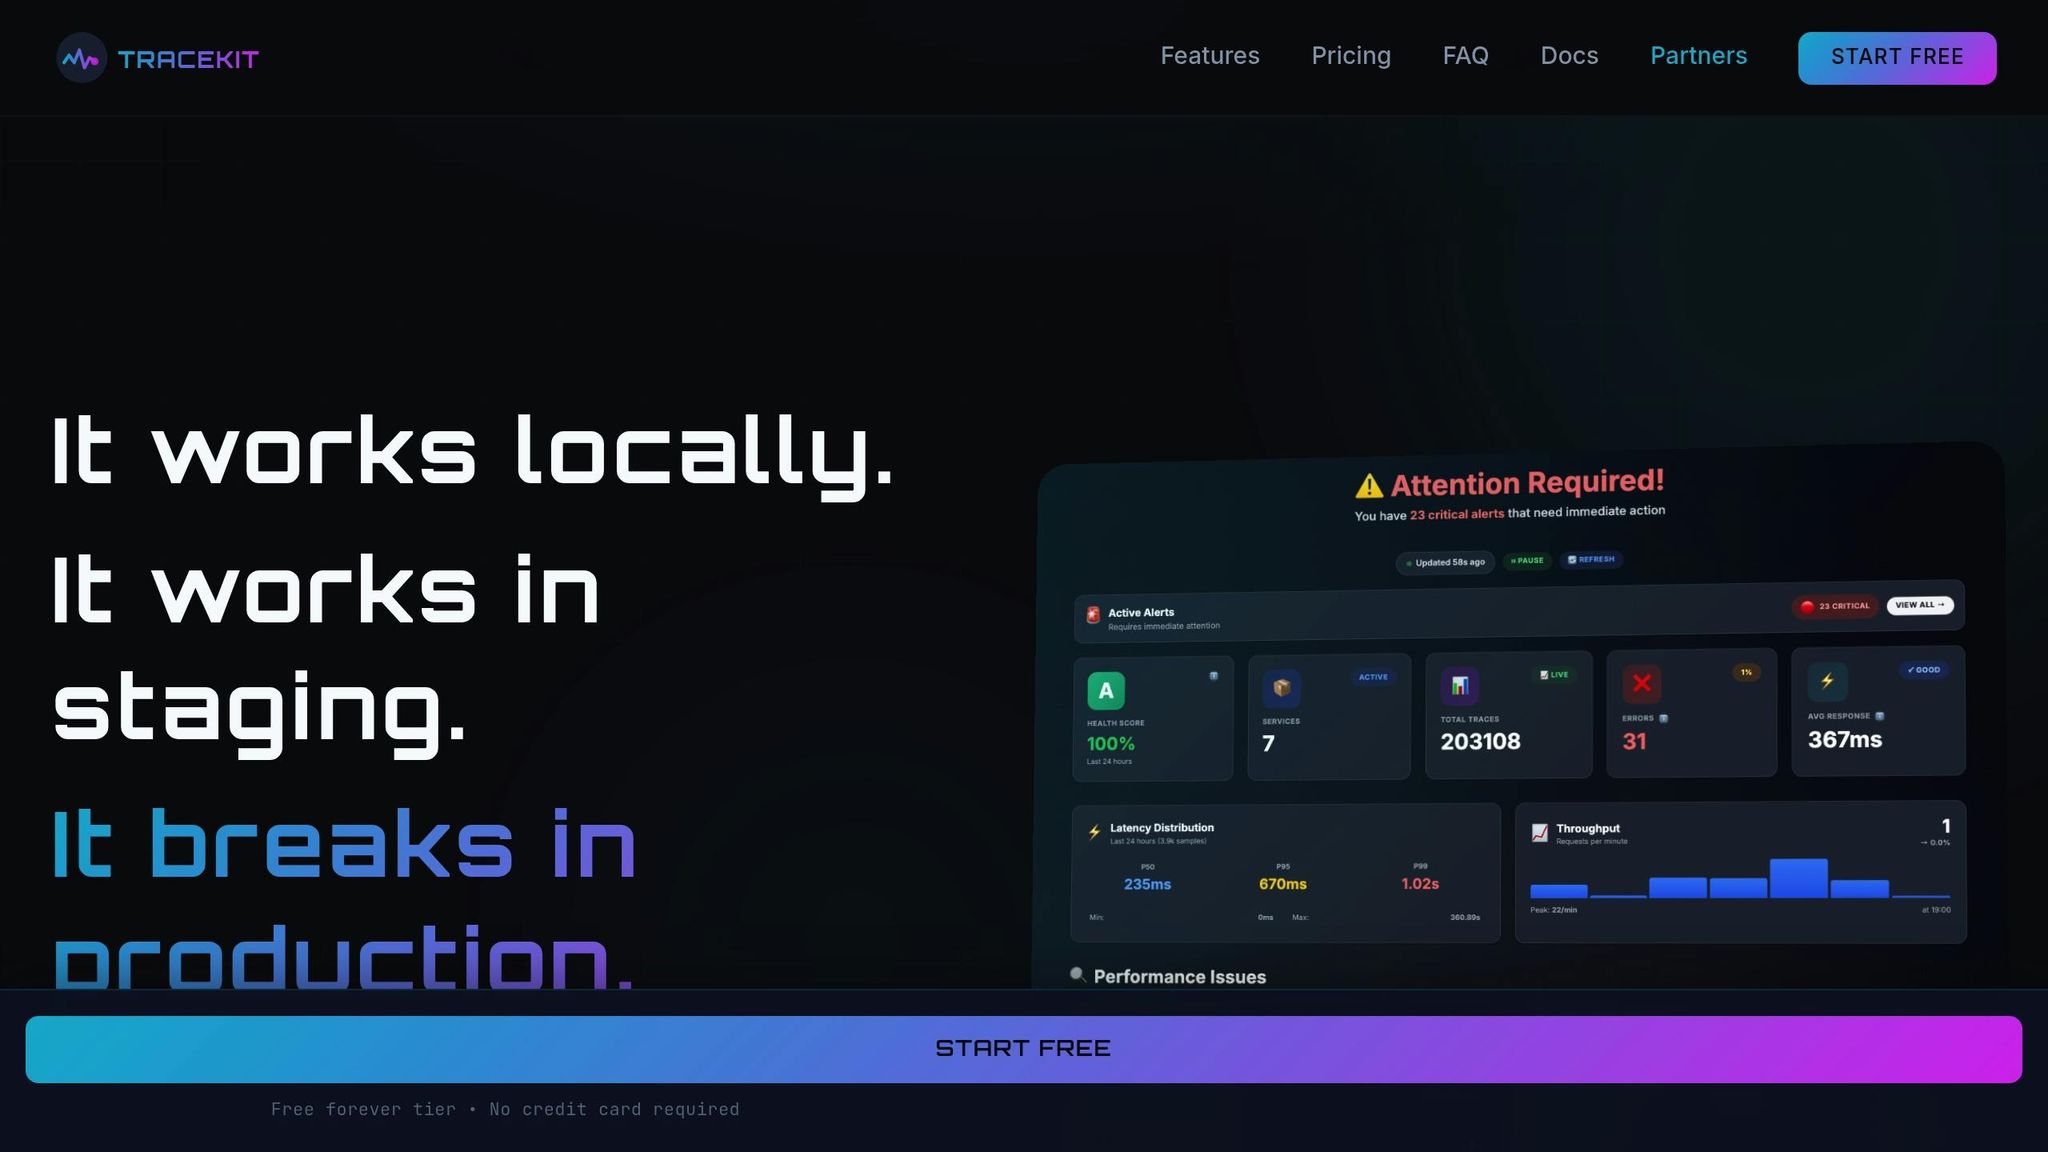
When it comes to debugging in production, live breakpoints can be a game-changer - especially when paired with the right tools. TraceKit makes this advanced capability accessible to small and medium-sized teams, offering an easy setup and affordable pricing.
How TraceKit Works
TraceKit simplifies production debugging with automatic instrumentation. With just one line of code, it captures complete variable states, stack traces, and request flows in real time - without disrupting production. Its standout "Instant Context" feature provides immediate visibility into request flows across distributed systems.
What sets TraceKit apart is its AI-driven analysis, which identifies patterns and anomalies automatically. This means you can uncover root causes much faster than sifting through logs manually. The platform supports a wide range of languages and frameworks, including:
- PHP (Laravel, Symfony, WordPress)
- Node.js (Express, NestJS, Fastify)
- Python (Django, Flask, FastAPI)
- Go, Java, and Ruby
Even better? The setup takes about 5 minutes - significantly shorter than the 2–4 weeks often needed for traditional APM tools. These features make TraceKit a practical, real-time solution for tackling production bugs efficiently.
"Every minute spent debugging is a minute not spent shipping features. We're here to give you those minutes back." – TraceKit
TraceKit for Small Teams
TraceKit isn’t just about technical efficiency - it’s also designed to be budget-friendly for smaller teams. While traditional APM tools can cost anywhere from $50,000 to $250,000 annually, TraceKit starts at just $29 per month and includes a 7-day free trial. The pricing is flexible, with no annual contracts, so you can cancel anytime.
For example, the Starter plan offers:
- 1 million traces per month (roughly 100,000 requests per day)
- 30-day data retention
- Unlimited team members
As your team grows, higher-tier plans are available to meet expanded needs.
The simplicity of TraceKit reflects its mission: to provide a tool that’s effective without being overly expensive or complicated. This means small teams can start addressing production issues almost immediately - skipping the weeks of setup and training that other solutions often require.
Conclusion: Choosing the Right Debugging Approach
Key Takeaways
When deciding on a debugging strategy, the choice often depends on the environment. Traditional debugging is ideal for local development or staging, where you can pause the application and step through the code without disrupting users. On the other hand, live breakpoints are better suited for production environments where interruptions are not an option. They capture variable states and stack traces in real time, all without halting application execution.
Dynamic logs also brings added security benefits by eliminating the need for admin-level server access or inbound connections. This approach aligns with the demands of modern, distributed systems, where traditional debugging methods often fall short. The ability to minimize disruptions while gaining valuable insights makes dynamic logs a practical choice for production scenarios.
Final Recommendation
For production environments, live breakpoints stand out as a reliable and efficient solution. They eliminate the delays associated with traditional logging and redeployment cycles, providing immediate insights that help resolve issues faster.
Tools like TraceKit simplify production debugging with features like live breakpoints, AI-driven analysis, and support for popular programming languages like PHP, Node.js, Python, Go, Java, and Ruby. With these capabilities, you can tackle production issues in minutes instead of weeks. The ultimate goal is to select a tool that matches your team's technical needs, budget, and size while maintaining the performance and security standards essential for production environments.
FAQs
How do live breakpoints minimize performance impact in production environments?
Live breakpoints are built to minimize any impact on your application's performance by using non-intrusive instrumentation. Rather than halting the application, they collect specific data - like stack traces and variable values - only when the breakpoint is triggered. This approach ensures your application keeps running smoothly, without introducing delays or extra latency.
What’s even better? The process is fully dynamic. You don’t need to modify your code or redeploy your application to use live breakpoints. Data collection is confined to the exact line of code where the breakpoint is set, eliminating the overhead caused by constant sampling. By zeroing in on the necessary details, live breakpoints conserve system resources like CPU and memory, while still delivering the precise snapshots you need for debugging.
How do live breakpoints enhance security compared to traditional debugging?
Live breakpoints, often referred to as tracepoints, are a tool for gathering variable states and stack information without halting the application or requiring debugging ports to be opened. This approach minimizes potential vulnerabilities by keeping the attack surface smaller. Data collected through live breakpoints is sent over encrypted and authenticated channels, with access managed via role-based controls and audit logs. This ensures alignment with enterprise-level security standards.
In contrast, traditional debugging typically involves attaching a remote debugger to a live process, which necessitates opening a debugging port. If not properly secured, such ports can become an entry point for attackers. Additionally, this method often exposes sensitive in-memory data, such as credentials, and requires elevated privileges, which can increase the risk of supply chain attacks.
By eliminating open ports, avoiding execution pauses, and implementing robust security measures, live breakpoints offer a safer and more secure option for use in production environments.
When are live breakpoints more effective than traditional debugging methods?
Live breakpoints are a game-changer when it comes to tackling production issues that traditional debugging methods struggle to handle. They let you observe your code as it executes in real-time, giving you access to variable states, stack traces, and request contexts - all without halting the application or requiring a redeployment. This makes them incredibly effective for solving bugs that only occur in production, handling time-critical incidents where every second counts, and unraveling complex problems in distributed systems that demand a full view across multiple services.
Tools like TraceKit take this to the next level by allowing teams to debug live code directly in production. This not only minimizes downtime but also boosts efficiency. Live breakpoints offer a modern, non-disruptive way to debug in environments where maintaining uptime is critical and traditional approaches just don’t cut it.
Related Blog Posts
Related Posts

Sentry vs TraceKit: Error Tracking vs Full Debugging
Sentry vs TraceKit compared: error tracking vs full production debugging. Feature-by-feature comparison with pricing, setup time, and use case guidance.

Production Debugging: When to Use Logs vs. Live Breakpoints
When to use logs vs live breakpoints in production. Logs track event history; live breakpoints inspect variables in real time without redeploying.

What Are Live Breakpoints and How Do They Work?
How live breakpoints work: debug production apps without pausing them. Capture variable snapshots, call stacks, and performance data in real time.