What Are Live Breakpoints and How Do They Work?
How live breakpoints work: debug production apps without pausing them. Capture variable snapshots, call stacks, and performance data in real time.

Live breakpoints let you debug live applications without pausing them or disrupting users. Unlike traditional breakpoints, they don’t stop execution but instead collect snapshots of the application’s state - like variable values, function arguments, and call stacks - while the app keeps running. These snapshots are sent to a dashboard for review, helping you troubleshoot issues in production environments efficiently.
Key Points:
- Debug live apps without downtime or redeployment.
- Use dynamic instrumentation to monitor specific lines of code.
- Collect real-time data (variables, performance metrics, etc.) with minimal performance impact.
- Ideal for production debugging, especially for intermittent or hard-to-reproduce issues.
- Manage breakpoints remotely via a dashboard and analyze detailed snapshots.
This approach simplifies debugging in complex systems, reduces troubleshooting time, and ensures uninterrupted service for users.
How Live Breakpoints Work
Technology Behind Live Breakpoints
Live breakpoints operate using dynamic instrumentation, a method that modifies running code without interrupting its execution. Essentially, they inject lightweight monitoring code directly into your live application, allowing it to capture data in real time without pausing or restarting the system.
The magic lies in bytecode manipulation and runtime hooks. When you set a live breakpoint, the debugging tool inserts a small piece of instrumentation code at the specified line. This code acts as an invisible observer, quietly gathering data whenever that line is executed. For compiled languages, this happens at the bytecode level, while for interpreted languages, it integrates directly with the runtime, intercepting execution at the designated points.
Unlike traditional breakpoints, live breakpoints don’t stop the program. Your application continues to process requests, handle transactions, and serve users as usual. The added instrumentation operates within microseconds, introducing only a tiny overhead - typically less than 1% of the execution time for the monitored line. This makes them safe for use even in production environments where performance is critical.
To keep things efficient, modern platforms use conditional triggers. These allow you to specify when a breakpoint should activate, such as when a variable exceeds a certain value, a specific user ID is involved, or a particular code path is executed. This targeted approach ensures that only relevant data is collected, minimizing unnecessary noise and keeping the performance impact negligible.
This dynamic instrumentation forms the backbone of the real-time debugging process described below.
Debugging Workflow with Live Breakpoints
Live breakpoints seamlessly integrate into your debugging routine, offering a practical way to inspect issues in a running application. The process begins by identifying the problematic part of your code - this could be a misbehaving function, a slow database query, or an API endpoint returning incorrect results.
Once you’ve located the line, you can place a live breakpoint using your debugging platform’s interface. Most platforms let you do this directly from your IDE or through a web dashboard, where you can browse your codebase and select the line number or file path.
After placing the breakpoint, the platform automatically injects the instrumentation into your live application. This happens without requiring a redeploy or restart, so your application keeps running uninterrupted. Within seconds, the breakpoint is active and begins monitoring the specified line of code.
When the instrumented line executes, the platform captures a detailed snapshot of the application’s state at that exact moment. This includes local variables, function parameters, object properties, and the full call stack. Each snapshot is timestamped and tagged with contextual data such as user IDs, session details, HTTP headers, and query parameters.
These snapshots are sent to your debugging dashboard in real time, allowing you to analyze them immediately or review them later. They provide a frozen-in-time view of your application, offering the same level of detail as a traditional debugger - without disrupting your application’s operation.
If the initial breakpoint doesn’t provide enough insight, you can modify its conditions, adjust what data is captured, or set additional breakpoints elsewhere. All of this can be done while your application continues to run normally.
Real-Time Data Collection
Live breakpoints don’t just capture variable values - they collect a wealth of information to help you understand what’s happening in your application. When a snapshot is triggered, the platform gathers a comprehensive dataset that offers a clear picture of the system’s state.
Variable inspection reveals the current state of all variables in scope, including local variables, function parameters, instance variables, and closure variables. Meanwhile, stack traces provide a detailed record of the function calls leading to that point, complete with file locations and line numbers. For complex objects, the platform can even capture nested properties to a configurable depth.
Additionally, the platform automatically collects request context, such as user information and session details for authenticated requests. This contextual data is invaluable for understanding not just what the code is doing, but why it’s behaving that way in a specific scenario.
Performance metrics are also included in the snapshot. These show how long the request has been running, where time is being spent in the code, and resource usage like memory allocation. This makes it easier to identify performance bottlenecks alongside functional issues.
To minimize the impact on your application, the data collection process is asynchronous. The instrumentation code quickly captures the necessary information in memory and hands it off to a background thread, which then transmits the data to the debugging platform. This ensures the main application thread continues running smoothly without delays caused by network operations.
Platforms also implement sampling and rate limiting to avoid overwhelming your system. You can configure how many snapshots to capture per minute, set limits on data size, or use probabilistic sampling to collect data from only a fraction of executions. This way, even if a breakpoint is hit thousands of times per second, you’ll still get useful insights without compromising performance.
This real-time data collection enables developers to diagnose and resolve production issues without disrupting services or affecting the user experience.
Live Breakpoints vs. Traditional Breakpoints
Understanding the difference between live and traditional breakpoints can shape how you approach debugging. While both serve to inspect code, they function differently and are best suited for distinct scenarios.
Traditional breakpoints are often the first debugging tool developers encounter. When you set one in your IDE, the program halts entirely at that point, allowing you to step through the code and inspect or modify values. This method works well in development environments where stopping the application doesn’t cause disruptions.
Live breakpoints, on the other hand, monitor code execution in real time without stopping the application. They capture snapshots of the system's state while allowing users to continue their interactions seamlessly. Transactions proceed as usual, and overall performance remains mostly unaffected. This makes live breakpoints especially useful in environments where service continuity is critical, such as production systems.
The key difference lies in their practicality for production environments. Pausing a live system with traditional breakpoints disrupts service, making them unsuitable for such cases. Live breakpoints, however, allow debugging in production without interrupting operations.
Performance impact also varies. Traditional breakpoints pause the application entirely, while live breakpoints collect data with minimal overhead. This makes live breakpoints a better fit for high-traffic systems.
Comparison Table: Live vs. Traditional Breakpoints
| Feature | Traditional Breakpoints | Live Breakpoints |
|---|---|---|
| Execution Behavior | Halts application execution entirely | Keeps the application running |
| Performance Impact | Full pause in execution | Minimal overhead |
| Environment | Best for development/testing | Suitable for development and production |
| User Impact | Interrupts user service | No noticeable disruption |
| Data Collection | Interactive, step-by-step inspection | Automated snapshots |
| Setup Requirements | Requires attaching a debugger | Configured remotely, no redeployment |
| Deployment | Debugger attached to the app process | Works on running apps via instrumentation |
| Data Availability | Real-time during pause | Asynchronous, viewed in a dashboard |
| Concurrency | Handles one thread during pause | Captures data across multiple threads |
| Modification | Allows variable changes | Read-only view of execution state |
| Session Duration | Controlled manually | Time-limited snapshots with auto-cleanup |
When to Use Live Breakpoints
Live breakpoints shine in specific scenarios, especially in production environments. For instance, if a bug only appears under live conditions - perhaps due to unique traffic patterns or production data - live breakpoints let you investigate the issue without taking the system offline or affecting users.
They're also ideal for troubleshooting intermittent issues that are hard to replicate. Instead of trying to recreate the exact conditions in a dev environment, you can set live breakpoints in production and wait for the problem to occur naturally. When it does, the snapshots provide detailed insights, including user sessions, request parameters, and system state.
In distributed systems, live breakpoints are especially effective. Debugging a request that spans multiple microservices using traditional breakpoints can be tedious, requiring you to attach debuggers to each service and manage pauses across them. Live breakpoints, however, collect data independently from each service, giving you a complete picture of the request flow without disrupting operations.
Another advantage is their ability to capture performance insights without affecting execution timing. Since live breakpoints don’t halt the application, they provide accurate timing information, reflecting real-world conditions. This makes them particularly useful for diagnosing race conditions and concurrency issues. Traditional breakpoints, by altering execution timing, can sometimes obscure these issues - an effect often referred to as a Heisenbug. Live breakpoints avoid this problem by preserving the system’s natural behavior.
That said, traditional breakpoints still have their place. They’re invaluable when you need to step through code line by line, modify variables, or evaluate expressions in real time. They’re also a great tool for exploring and understanding unfamiliar codebases during development.
Ultimately, your choice between live and traditional breakpoints depends on your specific needs. If pausing the application is acceptable, traditional breakpoints offer precise control. But when uninterrupted operation is critical - whether due to production demands or system complexity - live breakpoints are the better option.
Setting Up and Using Live Breakpoints
When it comes to debugging in real-time, setting up and strategically placing live breakpoints is key to gathering actionable insights without disrupting your production environment.
Enabling Live Breakpoint Features
To get started with live breakpoints, you'll need to install an agent or SDK that works alongside your application. This agent communicates with a remote dashboard where you can manage breakpoints and review the data they collect.
Here’s how it works: add a dependency to your project and configure it with just a few lines of code. For example, in a Node.js application, you might install the required package using npm and include a short configuration snippet in your main file. For PHP, this could involve adding an extension or a composer package. Once the setup is complete, you can manage breakpoints remotely without needing to redeploy your application.
Authentication is handled via an API key, typically stored as an environment variable. Once authenticated, the agent automatically instruments your application, detecting key elements like routes, queries, and execution points. Many popular frameworks are supported out of the box, so you can often begin using live breakpoints within minutes.
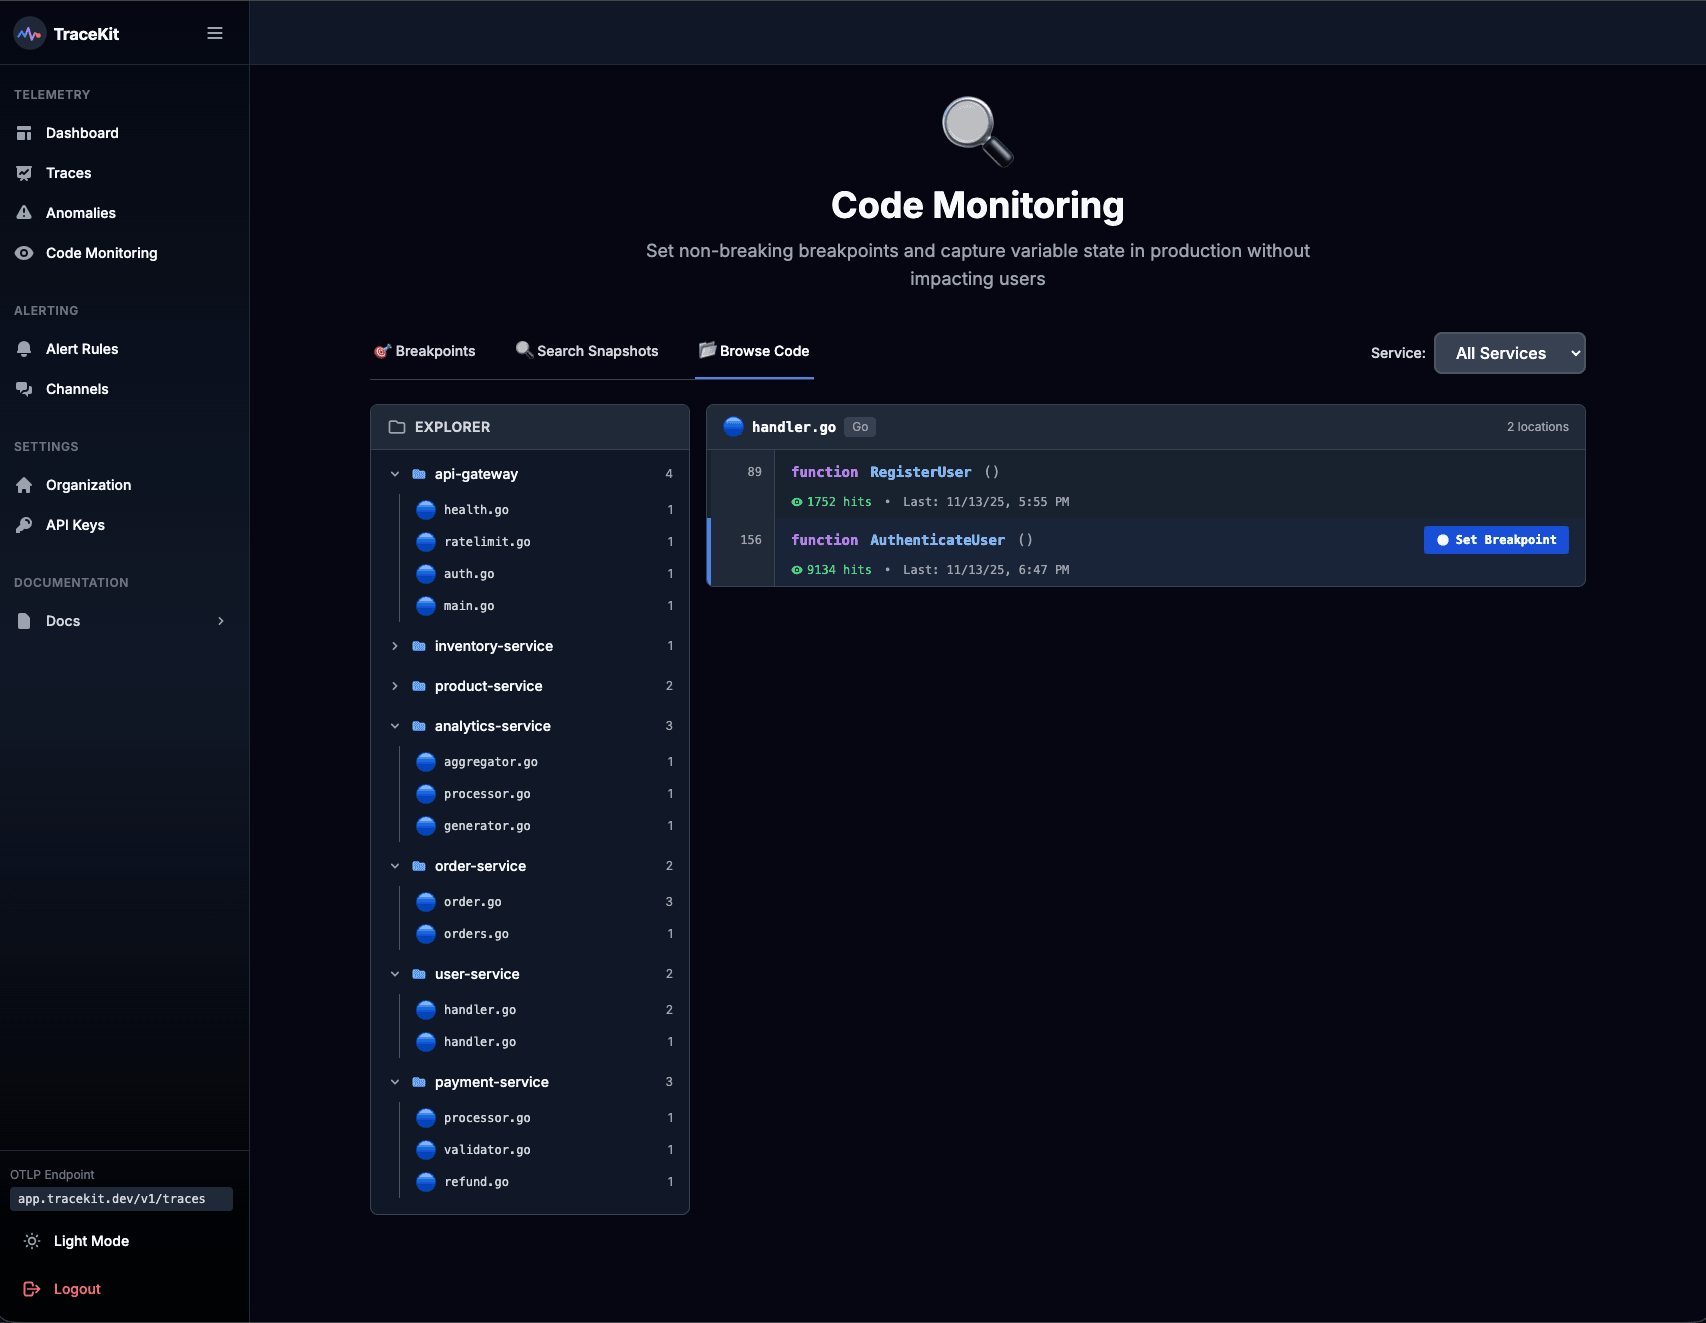
From the web-based dashboard, you’ll have a clear view of your application’s services. You can navigate through your file structure, set breakpoints at specific lines, and review captured snapshots - all in one place.
Best Practices for Placing Live Breakpoints
To make the most of live breakpoints, focus on placing them strategically. The goal is to capture meaningful data without overwhelming your system or cluttering your dashboard.
Start by identifying the critical path of the issue you’re troubleshooting. For instance, if there’s a problem in your checkout process, set breakpoints at key stages like validation and payment processing. This allows you to trace the flow of data without overloading your system by instrumenting every step.
Next, target decision points and state changes in your code. These include conditional statements, loops, and areas where data is transformed. For example, when debugging pricing errors, place one breakpoint before the price calculation logic and another right after. This helps you compare the input and output values to pinpoint where things go wrong.
Avoid placing breakpoints in tight loops or high-frequency code paths unless absolutely necessary. If you need to debug such areas, use conditional expressions to limit when the breakpoint collects data. This keeps your dashboard manageable and reduces system overhead.
Another helpful tip is to set expiration times for your breakpoints. For active debugging, a duration of 1–2 hours is often sufficient. If you’re monitoring an intermittent issue, you might extend this to 24 hours. Expiration ensures that breakpoints don’t linger unnecessarily.
Be mindful of the scope of data collection, particularly when dealing with sensitive information like passwords or API keys. Most platforms provide options to filter or redact sensitive data automatically, so take advantage of these features to maintain security.
In distributed systems, place breakpoints at service boundaries to capture data as requests enter and exit microservices. This approach provides a clear view of how data flows across your system.
Once your breakpoints are in place, the next step is to dive into the data they collect.
Analyzing Debugging Data
Each snapshot captured by a live breakpoint offers a detailed look at your application’s state at that exact moment. You’ll see the call stack, local variables, and the request context, including HTTP headers, user sessions, and query parameters.
Start by examining variable values at the breakpoint. Compare these values with your expectations - if something is null or incorrect, trace back through the call stack to find where the issue originates.
Timing data included in snapshots can also be incredibly revealing. Many platforms record timestamps that show when the breakpoint fired and how long various code sections took to execute. This helps you identify performance bottlenecks alongside logical errors.
The call stack is another critical tool. It shows the sequence of function calls leading to the breakpoint, which can help you uncover unexpected execution paths or deviations from your assumptions.
If you’re working with multiple snapshots from the same breakpoint, look for patterns and variations. For example, if some requests succeed while others fail, compare snapshots side by side. Differences in user roles, input parameters, or system states often hold the key to understanding the problem.
To streamline your analysis, use your platform’s filtering and search tools. You can search for specific variable values, filter snapshots by timestamp, or group them by request ID. This saves time and helps you zero in on the most relevant data.
Many platforms also let you correlate snapshots with other observability data, like logs, trace spans, or error reports. By connecting these data points, you can uncover insights that might not be obvious from a single source.
Once you’ve identified the root cause, take advantage of any annotation features your platform offers. Document your findings, including the problem, its cause, and the fix you implemented. This creates a valuable record for your team.
Finally, after deploying your fix, keep the breakpoints active for a short time to verify the solution. Monitor new snapshots to ensure the issue is resolved and no new problems have emerged.
Live Breakpoints in Production Debugging
Debugging in production environments is no easy task. When a problem arises in live code that's actively serving users, taking the application offline isn't an option. And often, the issue can't be replicated in a local or staging setup. This is where live breakpoints shine, offering a way to debug in real time without disrupting operations.
Debugging Production Without Downtime
Traditional debugging methods in production can feel like a hassle. You typically need to stop the application, add logging, redeploy, and then wait - sometimes endlessly - for the problem to resurface. It's a slow, disruptive process that can frustrate both developers and users.
Live breakpoints eliminate this headache. With the agent installed and running, you can set, adjust, or remove breakpoints directly from a web dashboard - all while your application keeps running smoothly. There's no need to stop servers, push new code, or inconvenience users.
Here’s how it works: when execution hits a live breakpoint, the agent captures a snapshot of the application’s state - variables, call stack, request context - and sends it to your dashboard. This happens in milliseconds, with no noticeable performance impact. Unlike traditional debuggers that pause execution, live breakpoints collect the data and let the code continue running seamlessly, ensuring users experience no delays.
This approach is particularly useful for tracking down elusive, intermittent bugs. For example, you might have an issue that only occurs when a specific user role accesses a feature or when database load hits a certain threshold. With live breakpoints, you can monitor the relevant code paths and wait for these conditions to naturally occur, capturing detailed insights when the problem arises.
Sensitive processes like authentication or payment flows often behave differently in production due to real-world factors like third-party integrations or live user data. Live breakpoints allow you to inspect these processes in detail without exposing sensitive information or disrupting transactions.
Real-Time Observability Use Cases
Live breakpoints are a game-changer when you need immediate insight into your application. Here are some scenarios where they can make a big difference:
- User-reported issues and data integrity problems: If a customer reports incorrect calculations or unexpected results, you can set breakpoints in the affected code. When the issue is reproduced, snapshots reveal the exact variable values and conditions, helping you trace the problem quickly.
- Performance anomalies: When response times spike, live breakpoints can pinpoint bottlenecks. For example, you might find that a database query is returning more data than expected or that an external API call is intermittently timing out.
- Edge cases and race conditions: These issues often only appear under specific production loads and are nearly impossible to recreate in testing environments. Live breakpoints allow you to capture the application state during these rare events, providing invaluable insights.
- Third-party integration failures: Debugging external service failures becomes easier when you can capture the exact request and response data at the moment of failure. Breakpoints at integration points reveal headers, payloads, and other critical details.
- Distributed system debugging: For applications with microservices, live breakpoints help trace requests across services. By setting breakpoints at key entry and exit points, you can track data transformations and pinpoint where errors occur.
These use cases fit seamlessly into the live breakpoint workflow, offering practical solutions to complex debugging challenges.
Security and Performance Considerations
Using live breakpoints in production requires a careful balance between functionality, security, and performance. When configured correctly, the risks are minimal and well-managed.
Protecting sensitive data is a top priority. Snapshots can include sensitive information - like passwords or API keys - so modern platforms often provide features like automatic redaction and filtering. You can configure rules to exclude specific variables or mask sensitive fields before snapshots are sent. This ensures that critical data, such as environment variables or authentication tokens, remains secure.
Access control is another key factor. Role-based permissions allow you to limit who can set breakpoints or view debugging data, ensuring only authorized team members have access. This is especially important in larger teams or organizations with strict data policies.
Performance impact is minimal when live breakpoints are used thoughtfully. To avoid unnecessary overhead, you can use conditional expressions to control when snapshots are captured. For example, you might configure a breakpoint to trigger only for specific user IDs or when certain variables exceed a threshold. This keeps the snapshot volume manageable while still providing the data you need.
Network bandwidth is another consideration. Snapshot data is transmitted from your servers to the debugging platform, which can use bandwidth and incur data transfer costs. Most platforms compress this data, and you can adjust settings to control the size and frequency of captures.
Expiration policies help ensure that breakpoints don’t run indefinitely. Configuring breakpoints to expire after a set time - such as 1 to 24 hours - or after capturing a specific number of snapshots prevents unnecessary resource usage. Many platforms also include automatic safeguards to disable breakpoints once their purpose has been served.
Production environment isolation is a smart practice. While live breakpoints are safe for production use, you might choose to enable them only in certain environments or for a subset of traffic. Canary deployments or blue-green setups are effective ways to test changes while maintaining a fallback option.
Finally, an audit trail adds accountability. Most platforms log every breakpoint action - creation, modification, deletion - along with timestamps and user details. This provides a clear record of debugging activities, which can be useful for compliance or post-incident reviews.
When configured with proper security measures and performance safeguards, live breakpoints offer a powerful way to debug production issues in real time. They let you tackle problems without downtime, redeployment, or disruption, transforming how teams handle production debugging.
Conclusion
Live breakpoints have revolutionized production debugging by enabling real-time data capture without disrupting your application’s flow. You can set, adjust, or remove breakpoints directly from a web dashboard while your app continues running - no server restarts, code changes, or redeployments required. When a breakpoint is triggered, the agent instantly captures a complete snapshot of your app’s state in milliseconds, all without impacting performance or user experience. Here’s a quick recap of the core benefits.
Key Takeaways
Debugging without disruption is the standout feature. Live breakpoints let you inspect your code in production while users continue interacting with the application as usual.
Real-time data access is a game changer for tracking down complex bugs. Whether you’re dealing with hard-to-reproduce issues, race conditions, or third-party integration problems, live breakpoints allow you to capture the exact state of the application at the moment the issue occurs. This eliminates the frustration of trying to replicate bugs in staging environments that don’t mirror production.
Faster problem-solving is the natural result. Instead of relying on logging, redeploying, and waiting for issues to reappear, live breakpoints provide instant insights. For user-reported bugs, performance bottlenecks, or data inconsistencies, you can quickly pinpoint the root cause. This speed is especially critical in distributed systems, where tracing problems across multiple services can otherwise take hours - or even days.
Security and performance are well-managed with the right configurations. Features like automatic redaction of sensitive data, role-based access controls, and conditional expressions ensure that snapshots are precise and secure. Expiration policies prevent breakpoints from lingering indefinitely, and audit trails maintain accountability.
Getting Started with Live Breakpoints
Ready to integrate live breakpoints into your workflow? Here’s how to get started. First, evaluate tools that support live breakpoints for your programming language. Many modern debugging platforms offer this capability for languages like PHP, Node.js, Go, Python, Java, and Ruby, often with automatic instrumentation for popular frameworks.
Installing an agent and configuring basic settings through the dashboard is generally a straightforward process. Look for tools offering zero-configuration setups to get up and running quickly.
When starting out, take a low-risk approach. Try setting breakpoints in non-critical sections of your code or during low-traffic periods to get comfortable with the process. Once confident, you can move on to more complex areas like authentication flows, payment systems, or interactions within distributed systems.
Prioritize security from the start. Configure redaction rules to protect sensitive variables, set role-based permissions for your team, and define expiration policies for breakpoints. These steps ensure data safety and maintain optimal performance.
For teams working with microservices or distributed architectures, live breakpoints are especially useful. By placing breakpoints at service boundaries, you can trace requests end-to-end, uncovering how data changes as it flows through your system. This level of visibility is hard to achieve with traditional debugging methods.
It’s important to note that live breakpoints don’t replace other debugging tools - they complement them. Together with logging, monitoring, and error tracking, they provide a more complete observability toolkit. When logs and metrics highlight an issue, live breakpoints give you the detailed, real-time context needed to resolve it efficiently.
Production debugging doesn’t have to be stressful or disruptive. With live breakpoints, you can confidently investigate issues, gather precise data, and fix problems faster - all while keeping your application running smoothly for users.
FAQs
How do live breakpoints work without slowing down a production environment?
Live breakpoints let you gather data seamlessly without interrupting your application’s flow. Instead of halting code execution, they rely on non-breaking breakpoints to collect real-time insights, ensuring your app runs smoothly.
They also support conditional breakpoints and logpoints, which let developers capture specific data or logs only when predefined conditions are met. This focused method keeps overhead low, making live breakpoints a reliable and efficient option for debugging in production settings.
How is sensitive data protected when using live breakpoints?
When working with live breakpoints, keeping sensitive data secure is absolutely crucial. Tools designed for this purpose typically include data masking and access controls to protect sensitive information during debugging. These features help block unauthorized access and ensure privacy is maintained.
Many live breakpoint tools also offer automatic data scrubbing, which removes sensitive details from logs and traces. This means you can debug directly in production environments without putting data security or compliance at risk.
How can live breakpoints help troubleshoot unpredictable issues in distributed systems?
Live breakpoints are an incredibly useful tool for troubleshooting tricky issues in distributed systems. They let developers examine live applications directly in production environments without causing any performance hiccups or needing to redeploy. This means you can tackle problems that are nearly impossible to recreate in a local setup.
By grabbing real-time data from specific spots in the code, live breakpoints offer a clear view of how applications behave across distributed, cloud-native platforms. This not only simplifies debugging but also speeds up the process of addressing those pesky, intermittent problems - helping to keep your applications running smoothly and reliably.
Related Blog Posts
Related Posts
Debug Production Live with Dynamic Logs
Debug production apps with dynamic logs and log points. Capture variable state without redeploying or stopping your application.

Laravel Production Debugging: Beyond Logs and Error Tracking
Debug Laravel in production beyond dd() and Log::info(). Use Telescope, dynamic logs, distributed tracing, and performance profiling.

Debug Production Without Redeploying: Step-by-Step Guide
Step-by-step guide to debugging production without redeploying. Set up dynamic logs for PHP, Node.js, Go, and Python in minutes.