Express.js Production Debugging Guide for Node Devs
Debug Express.js in production: error middleware, async handling, structured logging with Pino, OpenTelemetry tracing, and dynamic logs.

Debugging Express.js apps in production can be a challenge, especially with real user traffic, asynchronous code, and distributed systems. Here's what you need to know to streamline the process:
- Error Handling: Use middleware to catch and manage errors, including asynchronous ones. For Express 4, wrap async code in
try/catchblocks or use utilities likeasyncHandler. Express 5 simplifies this by automatically handling async errors. - Logging: Replace
console.logwith asynchronous logging tools like Pino (fastest), Winston (versatile), or JSON-based logging for better analysis. - Tracing: Use OpenTelemetry for distributed tracing, which tracks requests across middleware, databases, and services. Add custom spans to monitor specific operations.
- Dynamic Logs: Use Node.js Inspector or tools like TraceKit to set dynamic logs and diagnose issues without redeployment. Secure sessions via SSH to mitigate risks.
- Performance Optimization: Set
NODE_ENV=production, enable gzip compression, and run in cluster mode to improve response times. Use flame graphs to identify CPU bottlenecks.
Key Tools:
- TraceKit: Affordable dynamic logs and tracing at $29/month for small teams.
- Pino: Fast logging for high-traffic apps.
- OpenTelemetry: Distributed tracing for middleware and databases.
These strategies ensure better performance, faster issue resolution, and smoother production environments.
Netflix JavaScript Talks - Debugging Node.js in Production
Error Handling Patterns in Express.js
Effective error handling is a must for any production-level Express app. While Express provides some built-in tools for this, they need to be used properly, especially when dealing with asynchronous code.
Implementing Error-Handling Middleware
In Express, error-handling middleware is identified by its four-argument signature: (err, req, res, next) [5]. If you skip the next parameter, Express won't recognize it as error-handling middleware, and your errors won't be caught.
Here’s a basic example of how to set up error-handling middleware:
app.use((err, req, res, next) => { if (res.headersSent) { return next(err); } const statusCode = err.status || 500; res.status(statusCode).json({ status: 'error', message: err.message, ...(process.env.NODE_ENV !== 'production' && { stack: err.stack }) }); });
Notice the res.headersSent check. If headers have already been sent, you must call next(err) to let Express's default error handler take over and close the connection.
Placement is crucial. The error-handling middleware should always come last - after all other app.use() and route definitions - so it can catch errors thrown earlier in the request lifecycle.
For more flexibility, you can extend the built-in Error class to include custom properties like HTTP status codes:
class AppError extends Error { constructor(message, status) { super(message); this.status = status; this.isOperational = true; } } // Example usage in a route app.get('/users/:id', async (req, res, next) => { const user = await db.findUser(req.params.id); if (!user) { throw new AppError('User not found', 404); } res.json(user); });
By using this pattern, your global error handler can dynamically adjust the response status code and distinguish between operational errors (e.g., a missing resource) and unexpected programming errors.
With this middleware in place, the next step is managing errors in asynchronous code.
Handling Asynchronous Errors
One challenge in Express 4 is that errors in asynchronous functions don’t automatically reach the error handler. You need to wrap your async logic in a try/catch block and call next(err) manually:
app.get('/data', async (req, res, next) => { try { const data = await fetchData(); res.json(data); } catch (err) { next(err); } });
However, Express 5 simplifies this. It automatically captures errors from asynchronous functions, so you don’t need to explicitly call next(err). ************
| Feature | Express 4 | Express 5 |
|---|---|---|
| Synchronous Errors | Caught automatically | Caught automatically |
| Async (Callback) Errors | Must call | next(err) |
| Async (Promise) Errors | Requires | try/catch |
For those still using Express 4, an asyncHandler utility can streamline error handling by eliminating repetitive try/catch blocks:
const asyncHandler = (fn) => (req, res, next) => { Promise.resolve(fn(req, res, next)).catch(next); }; app.get('/data', asyncHandler(async (req, res) => { const data = await fetchData(); res.json(data); }));
It’s also important to handle errors from background tasks - like sending emails - that aren’t awaited within the request. These tasks need their own .catch() block to avoid unhandled promise rejections.
For external API calls, you can use AbortController to enforce timeouts and prevent hanging requests:
app.get('/external', async (req, res, next) => { const controller = new AbortController(); const timeout = setTimeout(() => controller.abort(), 5000); try { const response = await fetch('https://api.example.com', { signal: controller.signal }); clearTimeout(timeout); res.json(await response.json()); } catch (err) { if (err.name === 'AbortError') { return next(new AppError('Request timeout', 504)); } next(err); } });
In your error handler, you can check for err.name === 'AbortError' to send a 504 Gateway Timeout response. This ensures that your app gracefully manages cases where external services are unresponsive.
Debug Logging and Monitoring Setup
After setting up error handling, the next step in production monitoring is implementing a logging system that captures runtime issues effectively. Logging gives you a clear window into your application's inner workings, helping you diagnose problems and monitor performance.
Setting Up DEBUG Logging
Express includes a built-in debug module, but it’s disabled by default. To activate it, you need to set the DEBUG environment variable. This enables internal Express logs, covering routing, application logic, and more.
Here’s how to enable all Express logs with DEBUG=express:*:
- Linux/macOS: Run
DEBUG=express:* node index.js[4]. - Windows PowerShell: Use
$env:DEBUG = "express:*"; node index.js[4]. - Windows Command Prompt: Enter
set DEBUG=express:* & node index.js[6].
If you don’t need all logs, you can narrow the focus to specific namespaces like express:router or express:application. This approach helps you isolate parts of the request-response cycle without overwhelming yourself with unnecessary data [4]. Additionally, the debug module provides options like DEBUG_COLORS to control color-coded output and DEBUG_DEPTH to adjust object inspection depth [4].
Once debug logging is configured, it’s time to choose an asynchronous logging library for production monitoring.
Selecting a Logging Library
While console.log() and console.error() are fine for development, they’re not suitable for production since they operate synchronously when logging to a terminal or file. As the Express documentation notes:
"Using console.log() or console.error() to print log messages to the terminal is common practice in development. But these functions are synchronous when the destination is a terminal or a file, so they are not suitable for production." [2]
For production environments, asynchronous logging libraries like Winston, Pino, and Bunyan are better options:
- Winston: Known for its versatility, Winston supports multiple "transports", allowing you to send logs to files, databases, or external services simultaneously [9][10].
- Pino: The fastest option, Pino handles over 10,000 logs per second and operates roughly five times faster than Winston [10]. It’s the recommended choice for high-traffic production environments, as noted in the Express documentation:
"If you're logging app activity (for example, tracking traffic or API calls), instead of using console.log(), use a logging library like Pino, which is the fastest and most efficient option available." [2]
- Bunyan: Once popular, Bunyan is now deprecated in favor of Pino [11].
No matter which library you pick, always log in JSON format for production. JSON logs are machine-readable, making them easier to analyze with platforms like ELK Stack, Papertrail, or Datadog [10]. Use severity levels such as error, warn, info, and debug to filter logs and focus on critical issues [7]. Additionally, ensure logs are sanitized to prevent sensitive data like passwords, tokens, or credit card numbers from being exposed [7].
With logging set up, the next step is to explore methods for dynamic logs without redeploying your application.
Distributed Tracing and Application Instrumentation
Once you’ve established solid logging practices, the next step in production monitoring is implementing distributed tracing. This approach helps you track the flow of requests and identify performance bottlenecks across your system.
Tracing Requests Through Middleware
OpenTelemetry is a powerful tool for instrumenting core modules like http and Express. It generates spans for middleware and request handlers, giving you detailed visibility into your application’s behavior. To enable this, make sure you configure tracing before any application code runs. You can launch your app with the following command:
node --require ./otel.js app.js
This ensures OpenTelemetry wraps libraries before they’re used [12][13][14]. The @opentelemetry/instrumentation-express package is particularly useful, as it creates spans for every middleware in the chain. However, not all middleware is equally valuable for tracing. For example, you can exclude health checks or static asset handlers using ignoreIncomingRequestHook to skip endpoints like /health or /metrics. Similarly, you can use ignoreLayers to bypass specific routines like query or expressInit [12][15].
Want to add custom data to your spans? The requestHook option lets you include attributes such as user.id or order.id [12][13][15]. Here’s a quick reference for these configuration options: ``
| Option | Type | Description |
|---|---|---|
| ignoreLayers | Array | Skips specific middleware by name or regex (e.g., router, middleware). |
| requestHook | Function | Adds custom attributes to spans (e.g., |
| spanNameHook | Function | Customizes the name of spans for specific routes. |
That said, Express instrumentation has its limits, especially with asynchronous operations. As noted in the OpenTelemetry documentation:
"Because of the way express works, it's hard to correctly compute the time taken by asynchronous middlewares and request handlers. For this reason, the time you'll see reported... still only represent the synchronous execution time." [15]
While this may not capture the full picture of asynchronous tasks, it provides a strong starting point for monitoring your application’s performance.
Monitoring Database Queries and Async Operations
Tracing doesn’t stop at middleware. OpenTelemetry also supports tracking database queries and custom asynchronous workflows. Auto-instrumentation libraries are available for popular databases like PostgreSQL (@opentelemetry/instrumentation-pg), Redis (@opentelemetry/instrumentation-redis), and MongoDB. These tools automatically trace queries, capturing both execution time and query details [13][16].
For more complex workflows or custom async operations, you can manually create spans using tracer.startActiveSpan. Always wrap these spans in try...catch blocks, and don’t forget to handle exceptions with span.recordException(error). You can also update the span’s status using span.setStatus({ code: SpanStatusCode.ERROR }) to ensure accurate reporting [13][14].
In production, a BatchSpanProcessor can help manage performance by sending spans in batches, reducing network overhead [13][14]. OpenTelemetry is designed to have minimal impact on performance, typically adding less than 5% overhead [12]. For high-traffic systems, you can further reduce the load by sampling a smaller percentage of traces (e.g., 10%) [13].
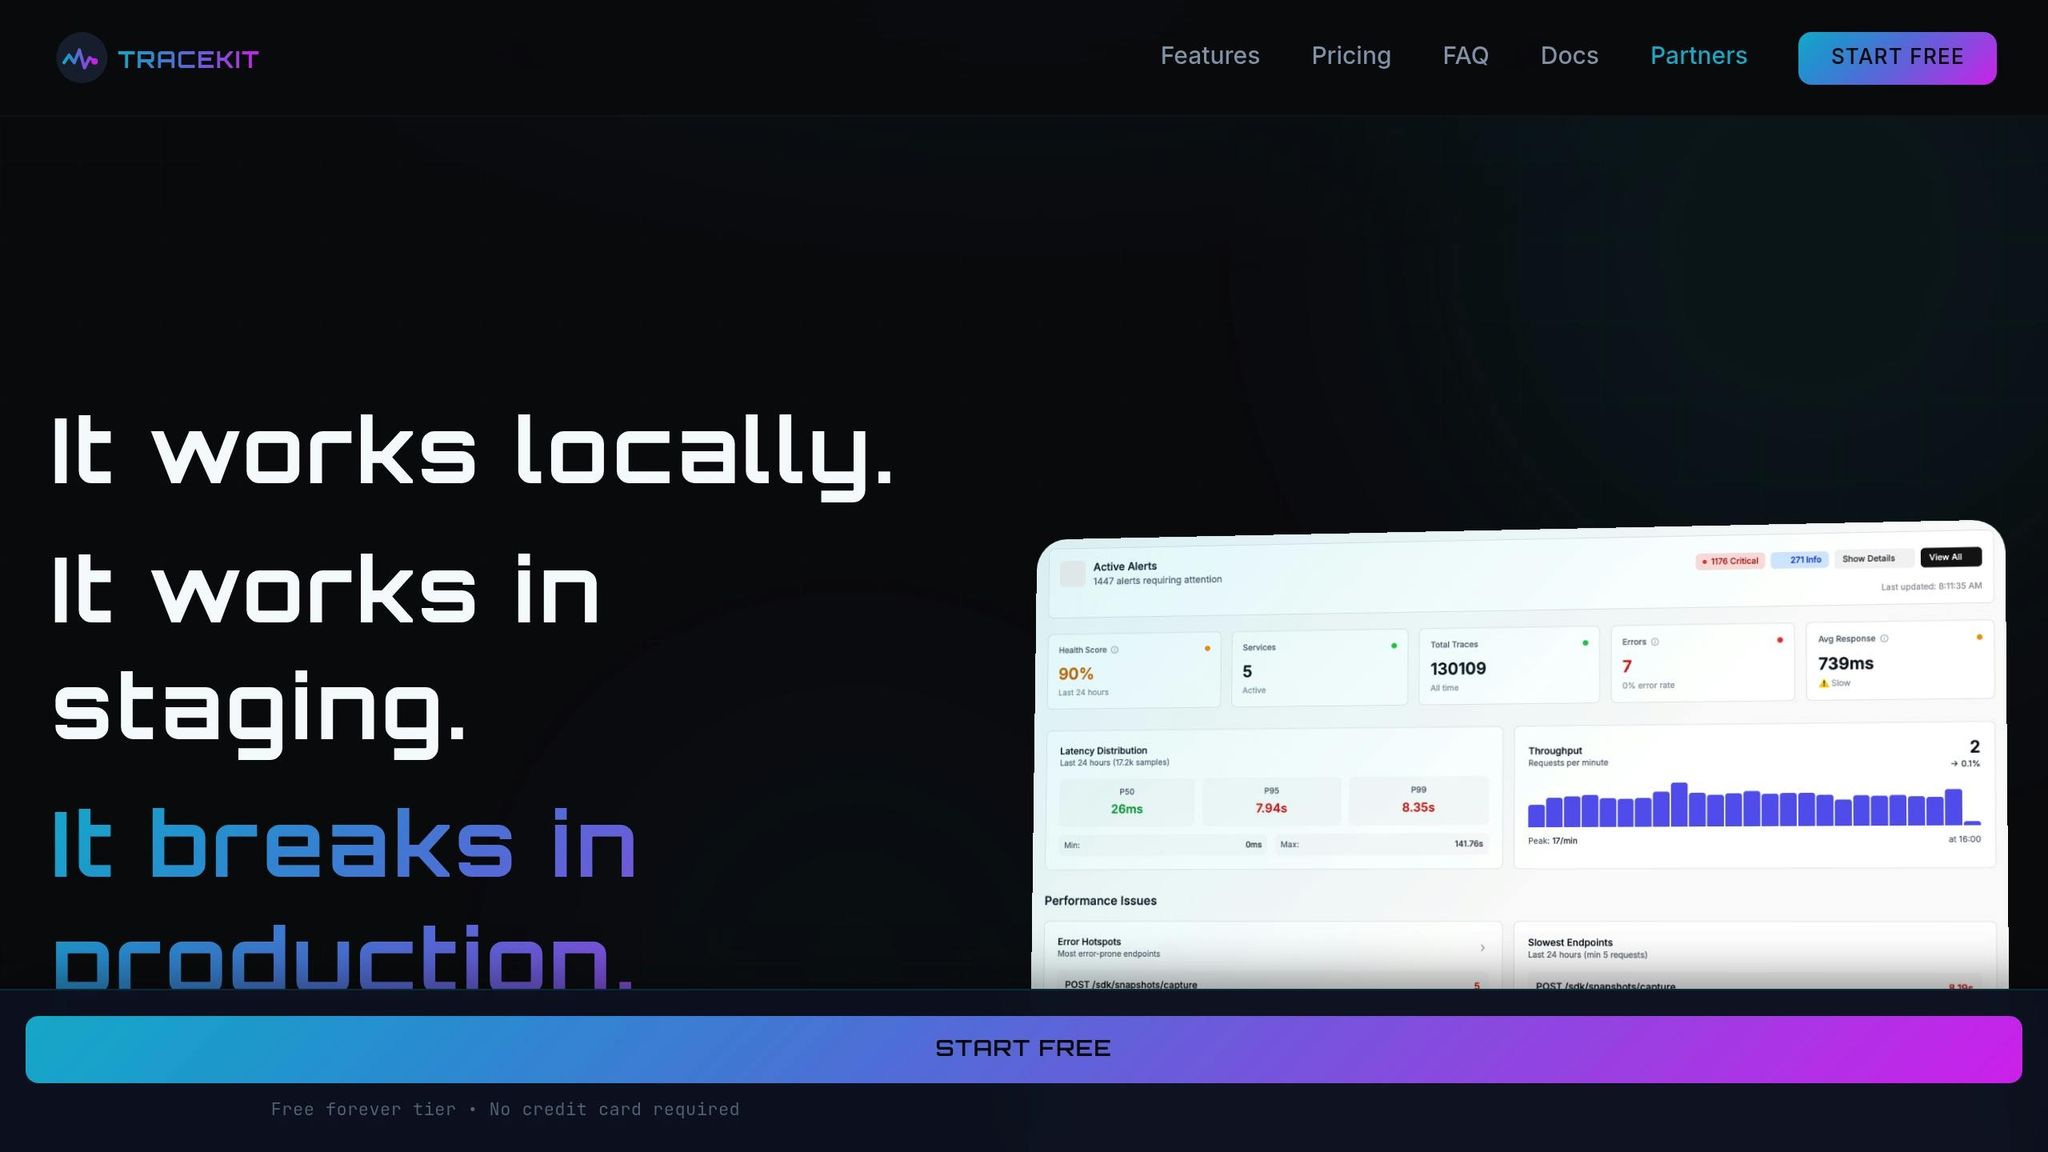
For dynamic logs without redeployment, tools like TraceKit offer a dynamic solution. TraceKit allows you to set dynamic logs, trace requests across distributed systems, and visualize dependencies through flame graphs and service maps - all without modifying your code. Starting at $29/month for 1 million traces, it’s a budget-friendly option for smaller teams compared to enterprise-grade platforms like Datadog.
Debugging Without Redeployment
Dynamic logs build on traditional logging and tracing by offering real-time insights into production issues - no redeployment or restarts required. When bugs arise in production, immediate investigation is critical. Node.js provides tools for this, but they must be handled carefully to avoid exposing security vulnerabilities.
Using Dynamic Logs
The Node.js Inspector allows you to connect debugging tools like Chrome DevTools or VS Code to a live process. To enable this, start your Express app with the --inspect flag, which activates the inspector agent on 127.0.0.1:9229 by default. Already running your app? No problem. On Linux and macOS, you can send a SIGUSR1 signal to the process to enable the inspector - no restart needed [17].
Once the inspector is active, you can head over to chrome://inspect in Chrome or use your IDE’s remote debugging feature. From there, you can set breakpoints, inspect variables, and step through your code, just like during development. However, keep in mind that the debugger has unrestricted access to the Node.js runtime. To mitigate risks, always bind the debugger to localhost and secure remote debugging sessions using SSH tunneling. For example:
ssh -L 9221:localhost:9229 user@remote.example.com
This command securely tunnels the inspector port [17].
Alternatively, tools like TraceKit simplify the process. TraceKit eliminates the need for manual SSH setup or inspector configuration. It enables dynamic logs, captures variable states in running code, traces requests across distributed systems, and even visualizes performance with flame graphs. Starting at $29/month for 1 million traces, it’s designed for teams needing production debugging without the complexity of traditional application performance monitoring (APM) platforms. This makes TraceKit an approachable option compared to more feature-heavy APM tools.
Once dynamic logs are set, the next step is ensuring they don’t disrupt your application’s performance.
Reducing Performance Impact
While dynamic logs provides valuable insights, it can pause the event loop, halting other requests and potentially disrupting service. For this reason, the inspector is best suited for targeted troubleshooting rather than ongoing monitoring [1].
To minimize impact, consider running Express in cluster mode using tools like PM2 or Node's built-in cluster module. This ensures that if one instance pauses for debugging, others can continue serving traffic [2]. Additionally, exclude high-traffic endpoints, such as /health or /metrics, from logging and tracing to reduce unnecessary overhead [12].
Finally, during testing, use the --trace-sync-io flag to identify and address any lingering synchronous API calls before they make it to production [2]. This proactive step can help maintain smooth performance even when debugging is necessary.
Performance Optimization and Bottleneck Resolution
After tackling debugging and tracing, the next step is optimizing performance and eliminating bottlenecks in production. Common culprits behind slowdowns include sluggish queries, inefficient middleware, or blocking synchronous code. Here's how to approach these challenges effectively.
Using Flame Graphs and Dependency Maps
Flame graphs are a powerful tool for identifying where your application spends excessive CPU time. They visualize CPU usage by function, making it easier to spot synchronous bottlenecks. As explained in the Node.js documentation:
"Flame graphs are a way of visualizing CPU time spent in functions. They can help you pin down where you spend too much time doing synchronous operations" [19].
To generate flame graphs, you can use tools like 0x or perf on Linux. For instance, the following command records CPU activity:
perf record -F99 -p <PID> -g -- sleep 3
If you're running Node.js 10 or later, enable the --interpreted-frames-native-stack flag to ensure function names are accurately displayed in the graph.
While flame graphs highlight CPU bottlenecks, service dependency maps help trace latency across microservices, databases, and external APIs. For teams without access to complex APM tools, TraceKit offers a cost-effective solution at $29/month for 1 million traces. It combines flame graphs and dependency maps with dynamic logs, capturing variable states for deeper insights.
Optimization Insights from Production Studies
Real-world data underscores the value of these techniques. A 2024 analysis of 200 production APIs revealed that systematic profiling with tools like clinic.js and load simulations cut response latency by 37% over six months. Focusing on slow endpoints can yield even bigger gains - response times dropped by up to 60% in some cases. Notably, over 80% of latency spikes were linked to inefficient middleware or blocking operations [18].
Production Configuration Best Practices
Once you've pinpointed bottlenecks, a few simple configuration changes can significantly improve performance:
- Set
NODE_ENV=production: This enables template caching and reduces logging verbosity, potentially tripling performance [2]. - Swap synchronous functions for asynchronous ones: For example, replace
fs.readFileSyncwith its async counterpart. Use the--trace-sync-ioflag during development to catch synchronous calls early. - Use efficient logging: Replace
console.logwith a faster logger like Pino. - Enable Gzip compression: Add middleware or use a reverse proxy like Nginx for compressed responses.
- Run in cluster mode: Use tools like PM2 or Node's cluster module to distribute workloads across CPU cores. This helps keep event loop lag below 10–20 ms [2] [20].
Comparison of Debugging Tools for Node.js
Node.js Debugging Tools Comparison: TraceKit vs Datadog vs Sentry vs New Relic
After diving into dynamic logs and performance tuning, the next step is choosing the right tool to maintain and improve production observability. Let’s break down how some popular debugging platforms stack up.
TraceKit vs Other Debugging Platforms
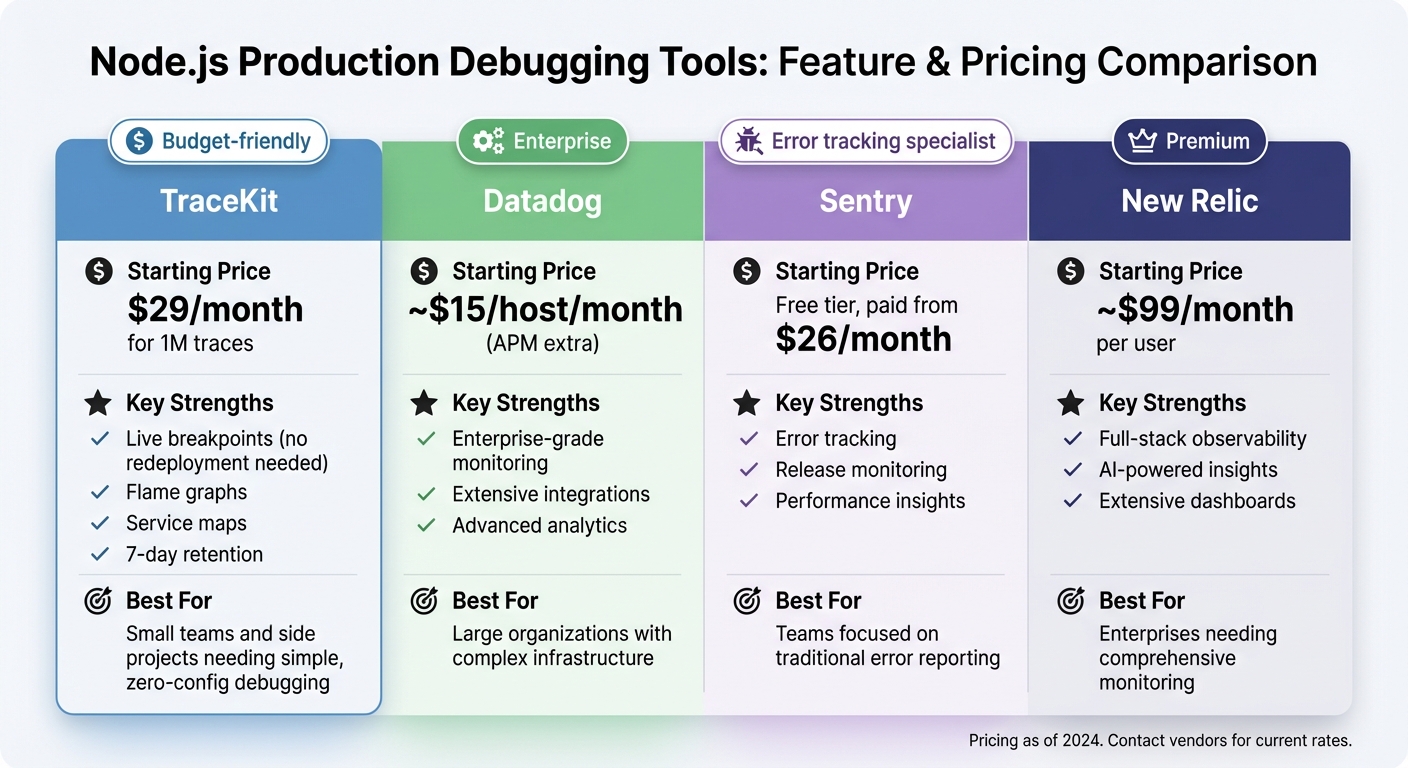
When it comes to debugging tools for production Express.js environments, the decision often boils down to features, pricing, and ease of use. Here's a quick comparison:
| Tool | Starting Price | Key Strengths | Best For |
|---|---|---|---|
| TraceKit | $29/month for 1M traces | Dynamic logging (no redeployment needed), flame graphs, service maps, 7-day retention | Small teams and side projects needing simple, zero-config debugging |
| Datadog | ~$15/host/month (APM extra) | Enterprise-grade monitoring, extensive integrations, advanced analytics | Large organizations with complex infrastructure |
| Sentry | Free tier, paid from $26/month | Error tracking, release monitoring, performance insights | Teams focused on traditional error reporting |
| New Relic | ~$99/month per user | Full-stack observability, AI-powered insights, extensive dashboards | Enterprises needing comprehensive monitoring |
TraceKit sets itself apart with dynamic log capture points that don’t require redeployment. This lets developers capture variable state in production code - a feature you won’t typically find in error trackers like Sentry. Additionally, TraceKit offers built-in flame graphs and distributed tracing at a competitive price point.
Choosing the Right Tool for Your Team
For startups or small teams working with tighter budgets, TraceKit’s Starter plan at $29/month delivers essential features like distributed tracing, dynamic logs, and performance visualization. Plus, its zero-configuration setup means you can instrument your Express.js app in just minutes.
If your team needs more capacity, the Growth plan at $99/month (10M traces per month, 30-day retention, and priority support) provides a cost-effective alternative to per-host pricing models like Datadog. This plan is especially appealing for teams managing multiple microservices.
On the other hand, larger organizations with dedicated DevOps teams and complex compliance requirements may prefer platforms like Datadog or New Relic. These tools come with broader feature sets, deeper integrations, and customizable retention policies - though they do come with higher costs.
TraceKit shines as an affordable, easy-to-use option for smaller teams, while other platforms cater to more complex or enterprise-level needs.
Conclusion and Key Takeaways
Summary of Debugging Strategies
Debugging in a production-grade Express.js environment calls for a structured and methodical approach. Start by implementing error-handling middleware using the standard four-argument signature (err, req, res, next) to catch and process errors effectively [5]. Replace basic console.log statements with professional logging tools like Winston or Pino, which offer structured logs, multiple log levels, and external transport options [8]. To track the flow of requests through middleware and monitor database performance, integrate distributed tracing into your setup. This allows you to pinpoint issues with precision. Additionally, using dynamic logs can be a game-changer, as they let you inspect variable states in real-time without the need for multiple redeployments.
On the performance side, setting the NODE_ENV variable to production can significantly boost your app’s efficiency through better caching [2]. Tools like flame graphs and dependency maps help identify bottlenecks, while enabling gzip compression and clustering ensures optimal resource utilization [2]. Together, these strategies create a solid framework for running a stable and high-performing production environment.
Next Steps for Developers
With these debugging and performance strategies in place, your next focus should be on ensuring long-term resilience and adaptability. Start by reinforcing your app with robust error-handling middleware and consider adding a /health endpoint to track system health [8]. Enable the DEBUG=express:* environment variable during troubleshooting to access detailed internal logs without altering your codebase [4]. Regularly run npm audit to identify and address vulnerabilities in your dependencies. Additionally, adopt a process manager like PM2 to handle automatic restarts and basic performance monitoring [3].
Choose debugging tools based on your team size and traffic needs. For example, TraceKit's Starter plan at $29/month offers features like dynamic logs, distributed tracing, and flame graphs for up to 1 million traces, making it a practical option for smaller teams. As Arunangshu Das, a Software Developer, wisely observed:
"The key to a stable production environment is preparation, so invest time in setting up these tools and processes before problems arise" [1].
Start small by implementing middleware and logging, and gradually expand to advanced tracing and monitoring tools as your application grows. This proactive approach ensures you’re ready to handle challenges as they come.
FAQs
What's the best way to handle asynchronous errors in Express.js?
To keep asynchronous errors under control in Express.js, it's important to ensure that all async route handlers and middleware pass errors correctly to the framework's error-handling system. Since errors inside async functions aren't caught by default, you can use a helper function like asyncHandler to wrap your routes. This approach ensures that any promise rejections are forwarded to next(err) for centralized error handling.
Here's an example of how it works:
const asyncHandler = fn => (req, res, next) => { Promise.resolve(fn(req, res, next)).catch(next); };
By using this wrapper, your async routes remain clean, and unhandled promise rejections are dealt with effectively. If you're working with Express 5 or later, things get even easier - rejected promises in route handlers are automatically routed to the error handler. This method keeps your error management consistent and your codebase easier to maintain.
What are the advantages of using distributed tracing with OpenTelemetry in Express.js apps?
Using distributed tracing with OpenTelemetry gives you a clear view of how your Express.js application is performing in real-world conditions. By gathering detailed telemetry data - such as traces, metrics, and logs - it helps you identify performance bottlenecks, track down error sources, and address latency problems across distributed systems.
Thanks to OpenTelemetry's standardized approach to instrumentation, you can easily trace requests as they move through microservices and external integrations. This not only boosts observability but also streamlines debugging and troubleshooting, all without needing to redeploy your code. These insights play a critical role in keeping your applications reliable and efficient, even in complex setups.
Why is it a good practice to use JSON format for logging in production?
Using JSON for logging in production is highly effective because it produces structured, machine-readable logs. This structured format allows logging tools and monitoring systems to easily parse, search, and analyze the data.
JSON logs shine in production debugging by capturing detailed context about requests, errors, and system behavior. They work effortlessly with modern observability tools, helping you trace issues faster and simplify troubleshooting.
Related Blog Posts
Related Posts

Debug Production Without Redeploying: Step-by-Step Guide
Step-by-step guide to debugging production without redeploying. Set up dynamic logs for PHP, Node.js, Go, and Python in minutes.
Your API Just Threw a 500. Here's How to Actually Fix It.
Your API threw a 500 at 3 AM. A systematic approach to diagnose, trace, and fix production API errors without the panic and guesswork.
Zero-Cost Production Visibility: APM Without the Datadog Bill
Get production visibility without the Datadog bill. Free-tier APM setup with OpenTelemetry for freelancers and small teams who need traces, not invoices.