
Debugging distributed systems is complex. Unlike single-server setups, distributed systems span multiple microservices and data centers, introducing challenges like fragmented logs, race conditions, partial failures, and clock skews. Traditional debugging tools often fall short in these scenarios.
Session context simplifies this process by attaching unique identifiers (like session.id and trace.id) to requests, enabling seamless tracking across services. This approach connects logs, traces, and metrics, providing a clear view of a request’s journey.
Key takeaways:
- Challenges in distributed debugging: Non-deterministic bugs, partial failures, and state inconsistencies.
- Session context components: Trace IDs, Span IDs, Correlation IDs, and Baggage for metadata.
- Benefits: Faster issue resolution, linked logs and traces, and reduced operational overhead.
- Implementation tips: Use correlation IDs, distributed tracing (OpenTelemetry), and structured logging.
Session context transforms debugging from a manual, time-intensive task into a streamlined, data-driven process. By integrating tools like OpenTelemetry and following best practices, you can efficiently resolve issues in complex systems.
Distributed Tracing Explained: OpenTelemetry & Jaeger Tutorial
Debugging Challenges in Distributed Systems
Distributed Systems Debugging Challenges: Impact and Root Causes
Debugging in distributed systems comes with its own set of hurdles that can make identifying and resolving issues a daunting task.
Non-determinism and Reproducibility
One of the toughest challenges in distributed systems is dealing with non-deterministic bugs. These bugs surface unpredictably because of factors like network delays, lost packets, and how threads interleave. Often, they arise only under specific timing conditions, making them nearly impossible to reproduce in a controlled environment [6][1].
"The paradox of distributed systems is that a one-in-a-million bug can be a huge urgent problem… but, it’s still a one-in-a-million bug, so a test probably won’t reproduce it!" – Will Wilson, Co-founder, Antithesis [8]
These elusive bugs, sometimes referred to as Heisenbugs, seem to disappear when you attempt to observe them using a debugger [7][9]. The act of debugging itself – whether by attaching tools or adding logging – can alter the system’s timing, further complicating efforts to replicate the issue [9].
Partial Failures and Latency Issues
Distributed systems rarely fail entirely. Instead, they tend to experience partial failures, where some services may function normally while others hang, timeout, or crash [6][1]. For instance, a slow database query in one microservice can tie up threads and connections in upstream services, eventually leading to resource exhaustion. This chain reaction, known as a cascading failure, can bring down multiple parts of the system [1].
Tools like circuit breakers (e.g., Hystrix or Resilience4j) can mitigate such failures by failing fast, but identifying the root cause – such as which service initiated the cascade – remains a challenge. Similarly, a cache failure can trigger what’s known as the thundering herd problem, where a sudden flood of requests overwhelms the database, escalating a minor issue into a major outage [1].
State Inconsistencies Across Services
Maintaining a consistent state across databases and caches in a distributed system is another tough nut to crack. Clock skew between servers can cause timestamps to be unreliable. For example, Server A might log an event timestamped in the "future" compared to Server B, making events appear out of order [1]. Network partitions can also lead to split-brain scenarios, where different parts of the cluster mistakenly operate as independent leaders, creating conflicting data [1].
On top of this, race conditions often emerge under production loads, and without a way to reconstruct the global state during an issue, developers are left sifting through logs from dozens of services. This process can be painstakingly slow, taking hours or even days to pinpoint the problem [6][1].
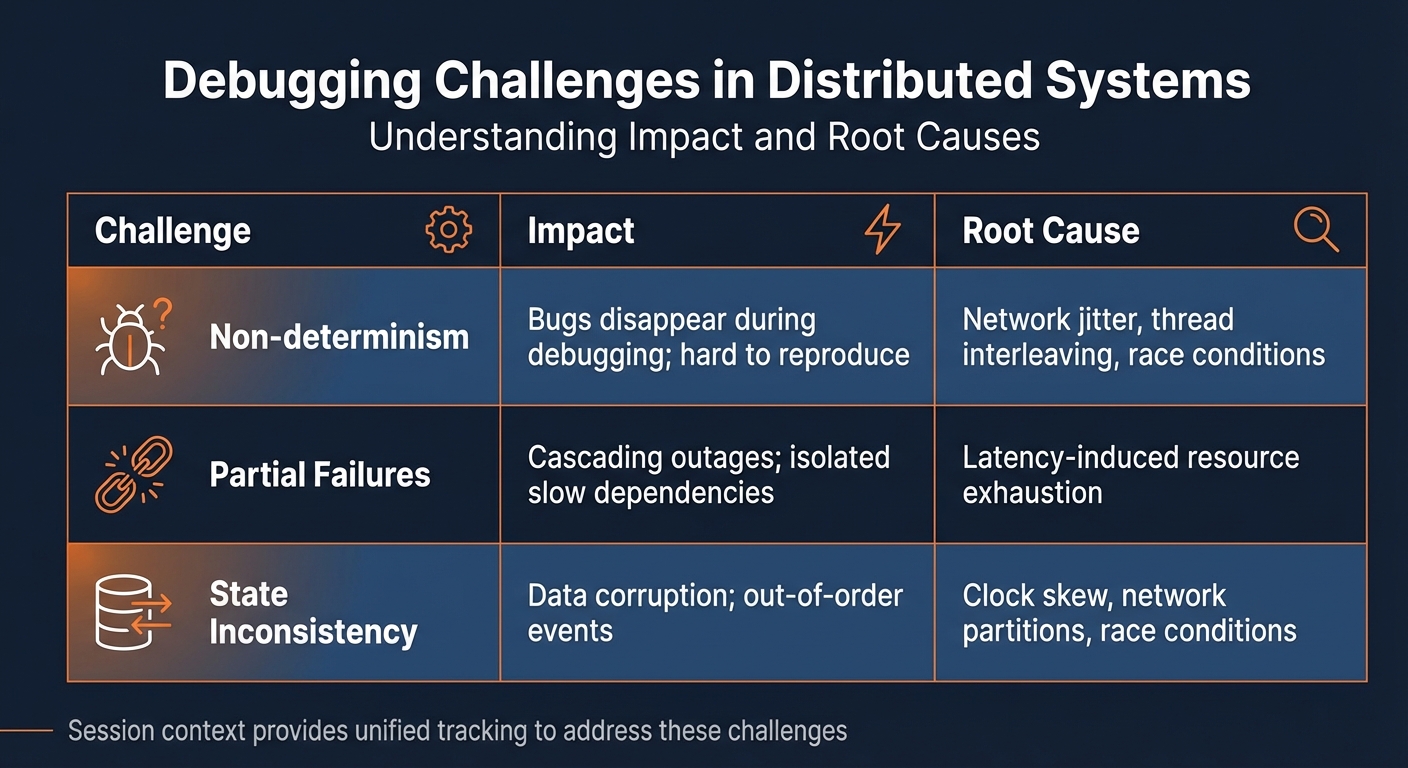
| Challenge | Impact | Root Cause |
|---|---|---|
| Non-determinism | Bugs disappear during debugging; hard to reproduce | Network jitter, thread interleaving, race conditions |
| Partial Failures | Cascading outages; isolated slow dependencies | Latency-induced resource exhaustion |
| State Inconsistency | Data corruption; out-of-order events | Clock skew, network partitions, race conditions |
Addressing these challenges requires a unified session context, which can help trace and resolve issues more effectively in distributed systems.
What is Session Context?
Session context is a way to connect data across distributed systems by linking all activities during a specific timeframe – whether initiated by an application or a user. It captures the entire journey, from the start of an action to its completion across various services [10].
The process relies on context propagation, which uses unique identifiers like Trace and Session IDs to connect traces, metrics, and logs across services. This ensures you can follow the exact path of a request and identify issues, rather than piecing together disconnected logs.
"Context is an object that contains the information for the sending and receiving service, or execution unit, to correlate one signal with another." – OpenTelemetry [3]
By connecting elements like database queries, API calls, and cache lookups, session context provides a complete view of user requests. This forms the foundation for understanding its components and advantages.
Components of Session Context
Several elements work together to create a clear picture of activity in your distributed system:
- Session IDs: These uniquely identify a user’s activity period. For example, OpenTelemetry specifies
session.idas a unique string, often a UUID, to link telemetry data to a specific user journey – even across multiple requests [10]. - Trace IDs and Span IDs: These are essential for distributed tracing. A Trace ID tracks the entire request path through your system, while Span IDs represent individual operations like a database query or API call. The W3C Trace Context standard defines the
traceparentheader, which includes fields liketrace-idandparent-id[5][11][13]. - Context Propagation: This transfers identifiers like Trace IDs across service boundaries, often through HTTP headers such as
traceparentandtracestate[5]. - Correlated Logs and Metrics: Logs include Trace and Span IDs, linking them to specific traces. Metrics are aggregated within these contexts, helping you analyze performance, such as response times for certain requests [3][11].
- Baggage: This carries key-value pairs, such as Customer ID or Region, across services for added context. However, sensitive data like credentials or PII should not be included, as this information is propagated and may be logged [3].
| Component | Purpose | Key Elements |
|---|---|---|
| Session | Tracks user activity over time | session.id, session.previous_id [10] |
| Trace | Tracks a request’s end-to-end path | trace_id [14] |
| Span | Tracks an operation within a trace | span_id, parent_id, timestamps [11][13] |
| Baggage | Carries metadata across services | Key-value pairs (e.g., customer_id=123) [3] |
| Log | Provides detailed event information | timestamp, message, severity [3] |
Together, these components address challenges like fragmented logs and race conditions, giving you a unified view of your system.
Benefits of Using Session Context
Session context simplifies debugging by automatically correlating logs, traces, and metrics. In modern microservices, a single user action can trigger multiple service calls – often between 5 and 15 [14]. With session context, you can quickly jump from a trace span to related logs without manually piecing data together [14][11].
This built-in correlation speeds up issue resolution. For instance, instead of combing through thousands of logs to find the root cause of a timeout, you can clearly see the sequence of events and pinpoint where delays occurred. This is especially useful for cascading failures, where one service’s delay impacts others.
By linking trace spans to log entries, session context provides both a high-level overview and detailed insights into your system’s performance. It treats traces as structured logs with built-in hierarchy and connections [14][11].
Finally, session context reduces operational overhead. It automates tasks like adding correlation IDs and ensuring proper propagation. Using standardized headers and conventions, it ensures consistency across services and teams, saving time and effort [14][11].
How to Implement Session Context
You can implement session context without completely reworking your system. Start by using correlation IDs to track requests, then expand into distributed tracing and metrics. Automating correlation can save you from manually linking logs.
From there, focus on integrating structured logging, distributed tracing, and metrics to create a unified session context.
Using Correlation IDs for Structured Logging
A Correlation ID is a unique identifier assigned to the initial incoming request, which is then passed along to every downstream component involved in that transaction [15]. This ID serves as a thread that ties together logs across services.
Typically, you generate the Correlation ID at the first entry point – like an API Gateway or the initial service handler [15]. The W3C TraceContext specification provides a standard format for this in the traceparent header [3].
"Correlation ID becomes the glue that binds the transaction together and helps to draw an overall picture of events." – Engineering Fundamentals Playbook, Microsoft [15]
Instead of creating custom logic for correlation, use OpenTelemetry SDKs to automatically inject the Trace ID and Span ID into your logs. To complete the loop, include the Correlation ID in your HTTP responses, allowing client-side logs to reference the same server-side transaction. Ensure the Correlation ID propagates through all parts of your system, including message queues and background jobs, to maintain a seamless trace [11].
Once correlation IDs are in place, distributed tracing can give you a broader view of how each request flows through your system.
Distributed Tracing with OpenTelemetry
Distributed tracing maps out a request’s entire journey across your system. Each trace represents a full request, while spans break it down into individual operations, such as database queries or API calls [14]. For smaller teams, OpenTelemetry’s auto-instrumentation tools can simplify adoption by automatically handling context propagation [16].
To track user sessions effectively, add a session.id attribute to the root span of each request [10]. This groups all activities from a single session, making it easier to understand the full user interaction. Additionally, include trace_id and span_id in your logs to directly link them to specific traces.
Here’s a quick breakdown of span types and their use cases:
| Span Kind | Use Case | Example |
|---|---|---|
| Server | Handles synchronous incoming requests | HTTP server handlers, gRPC servers |
| Client | Handles synchronous outgoing requests | Database queries, outbound HTTP calls |
| Producer | Creates asynchronous messages | Kafka publish, RabbitMQ send |
| Consumer | Processes asynchronous messages | Kafka consume, background job processing |
| Internal | Executes in-process operations | Business logic, data transformations |
Integrating Metrics and Real-Time Observability
Metrics provide insights into your system’s performance. Focus on key indicators like latency, error rates, and resource usage (e.g., CPU and memory).
OpenTelemetry simplifies the process by offering a unified API for traces, metrics, and logs. The OpenTelemetry Collector gathers telemetry data from your services and exports it to your chosen backend, whether for trace visualization or metrics storage. Following OpenTelemetry’s semantic conventions for attributes – like http.method or db.system – helps maintain consistency across your system.
"Context propagation is the core concept that enables Distributed Tracing. With Context Propagation, Spans can be correlated with each other and assembled into a trace, regardless of where Spans are generated." – OpenTelemetry [11]
sbb-itb-0fa91e4
Advanced Session Context Debugging Techniques
Once your session context is integrated into your system, you can take debugging to the next level. These advanced techniques help you diagnose problems faster and gain real-time insights into performance issues, going well beyond traditional logging and tracing methods.
Live Breakpoints and Dynamic Debugging
Live breakpoints allow you to capture snapshots of variables, stack traces, and session context under specific conditions – without disrupting active requests. This is where context propagation becomes a game-changer. By using headers like the W3C traceparent, session identity seamlessly flows across service boundaries. This ensures that live breakpoints in downstream services only trigger for the relevant upstream request.
For instance, OpenTelemetry Baggage can filter breakpoints based on attributes like customer_level or session_id, so you can target specific scenarios. Tools like TraceKit make this even easier. They let you set live breakpoints across multiple programming languages – PHP, Node.js, Go, Python, Java, and Ruby – without needing to redeploy your application. This is especially useful for session-specific debugging, as you can capture precise variable states for a particular user session while keeping other requests unaffected.
One crucial tip: sanitize incoming context when dealing with external services. Ignoring trace headers from untrusted sources can prevent malicious actors from triggering unwanted debug snapshots [3][17].
Analyzing Performance with Flame Graphs
Flame graphs are a powerful way to visualize profiling data, helping you quickly identify resource-intensive functions and call stack depths. The x-axis represents the total sample population (sorted alphabetically), while the y-axis shows the depth of the function call stack. Wider sections on the graph highlight functions consuming more resources [18].
"The flame graph provides a new visualization for profiler output and can make for much faster comprehension, reducing the time for root cause analysis."
– Brendan Gregg, Computer Performance Expert [18]
A great example of their effectiveness comes from a 2013 analysis of a MySQL database. Using flame graphs, engineers identified excessive CPU usage caused by join operations. Fixing the issue reduced CPU consumption by 40% [18]. When analyzing, look for large plateaus at the top edge (indicating high CPU consumption) and significant forks that reveal branching execution paths [18].
Service Dependency Mapping and Anomaly Detection
Service dependency maps give you a clear view of how your services interact, making it easier to trace which components are involved in a specific session. When combined with session context, these maps allow you to analyze metrics along distinct user paths. For example, you could compare the response times of database calls initiated by a "checkout" action versus a "cart" action.
Anomaly detection adds another layer by identifying outliers in call sequences. This helps surface unusual behavior in particular user flows, enabling you to address issues before they escalate. Together, these techniques provide a deeper understanding of how your system behaves under different conditions.
Session Context Best Practices
Session Context vs. Traditional Logging
Session context takes the hassle out of manual log correlation by automating the process across services. Instead of combing through scattered, timestamp-based logs, it provides a clear, hierarchical view of parent-child relationships, making it easier to understand cause and effect [11].
Here’s a quick comparison between traditional logging and session context:
| Feature | Traditional Logging | Session Context (Tracing) |
|---|---|---|
| Structure | Flat, chronological | Hierarchical, causal [11] |
| Correlation | Manual | Automatic [3] |
| Scope | Limited to a single service | Spans across processes and network boundaries [3] |
| Data Richness | Local state only | Includes "Baggage" (distributed metadata) [17] |
| Signal Integration | Isolated logs | Combines traces, metrics, and logs [3] |
Best Practices for Session Context Implementation
To fully benefit from session context, follow these guidelines to ensure smooth implementation and effective usage.
- Automate context propagation: Use instrumentation libraries to handle context injection automatically. Popular frameworks like Laravel and Symfony already support this, saving you from manual coding [3][16].
- Keep sensitive data out of Baggage: Avoid including PII, API keys, or credentials in Baggage metadata. Always sanitize headers from untrusted sources to prevent accidental exposure across service boundaries [3].
- Manage session lifecycles explicitly: Emit
session.startandsession.endevents to clearly define session boundaries. Use attributes likesession.previous_idto link sessions after timeouts. Adopting consistent semantic attributes (e.g.,session.id,http.method) ensures your data remains searchable across tools [10][11]. - Reflect sampling decisions downstream: When a component decides to record a session, make sure this choice is visible to downstream services via the
sampledflag. This helps maintain continuity for troubleshooting specific requests. According to the W3C Trace Context specification, vendors must support atracestateheader with at least 512 characters to allow proper propagation of vendor-specific metadata [5][4].
Conclusion
Session context brings together traces, metrics, and logs, offering a complete picture of every request’s journey through your system [2][3].
By leveraging open standards like OpenTelemetry and W3C Trace Context, you can achieve smooth, cross-platform instrumentation [2][4]. These standards make it easier to integrate and maintain observability tools across different environments.
Adopting session context isn’t just about faster debugging – it shifts your approach from reactive fixes to proactive system improvements. For example, flame graphs help pinpoint performance bottlenecks, service dependency maps highlight architectural challenges, and anomaly detection identifies issues before users even notice them [12].
To incorporate these practices, start with auto-instrumentation tailored to your framework – whether you’re using Laravel, Express, or Django. Implement standardized traceparent headers to preserve trace consistency [3]. These steps will help you build a secure and scalable observability strategy.
The use of 128-bit globally unique trace IDs in session context ensures precise tracking, even in systems managing millions of requests daily [4]. This approach eliminates the overhead often associated with traditional logging methods.
FAQs
How does session context help with debugging in distributed systems?
Session context makes debugging in distributed systems much more manageable by keeping a consistent trail of information across different services and components. It works by assigning a unique identifier to connect related events, requests, or transactions. This lets developers follow a request’s journey through various microservices and infrastructure layers, offering a full picture of how the system operates.
By linking events through session context, developers can pinpoint problems like failures or performance slowdowns without having to comb through endless logs manually. Tools like TraceKit take this concept further by enabling live debugging, capturing variable states, and tracking requests in real time. This method provides better visibility and speeds up issue resolution, which is crucial for handling the complexity of today’s distributed systems.
What is session context, and why is it important for debugging distributed systems?
Session context is all about keeping track of what happens during a specific session, whether it’s actions taken by the user or processes within the application. At its core, it relies on a unique session identifier and a detailed record of all the events and activities tied to that session. This identifier plays a key role in connecting logs, events, and traces across distributed systems, helping developers see how different parts of the system work together during a session.
It often goes beyond just actions, including metadata like timestamps, user details, or device information. This extra layer of detail provides a fuller picture of the session. With session context, developers can tackle debugging more effectively, better understand user behavior, and evaluate system performance – critical tasks for keeping distributed systems running smoothly.
How can I add session context to an existing distributed system?
Adding session context to a distributed system means passing relevant information between services to maintain consistency and make debugging easier. This is usually achieved through context propagation – a process where a context object containing session details travels with requests as they move through different services. This can be done using instrumentation libraries or by manually embedding context data into request headers or payloads.
If you need more precision, standardized formats like the W3C Trace Context can help. These formats ensure that trace identifiers and metadata are passed consistently across all parts of your system. Additionally, tools like TraceKit, which support live debugging, can make this process even smoother. They capture variable states and trace requests without requiring you to redeploy your system. By embedding session-specific data into your propagation strategy, you improve both debugging capabilities and system observability.