Debugging Distributed Systems: Guide for Small Teams
Debug distributed systems on a budget. Practical strategies for small teams: observability basics, centralized logging, OpenTelemetry, and AI-assisted diagnosis.

Debugging distributed systems can feel overwhelming, especially for small teams balancing limited resources. Unlike monolithic applications, issues in distributed systems often span multiple services, making them harder to trace and fix. This guide simplifies the process, offering practical, budget-friendly strategies to help small teams resolve errors efficiently.
Key Takeaways:
- Core Challenges: Non-deterministic behavior, race conditions, and limited debugging tools complicate troubleshooting.
- Observability Basics: Focus on metrics, logs, and distributed tracing to monitor and debug effectively.
- Cost-Saving Tips: Use centralized logging and OpenTelemetry for affordable observability.
- AI Assistance: Leverage AI for anomaly detection and automated root cause analysis.
- Practical Tools: Tools like TraceKit simplify debugging with dynamic logs, flame graphs, and service dependency maps.
With these strategies, small teams can confidently tackle even the most complex issues in distributed systems.
Debugging distributed systems
Building Observability: The Foundation of Debugging
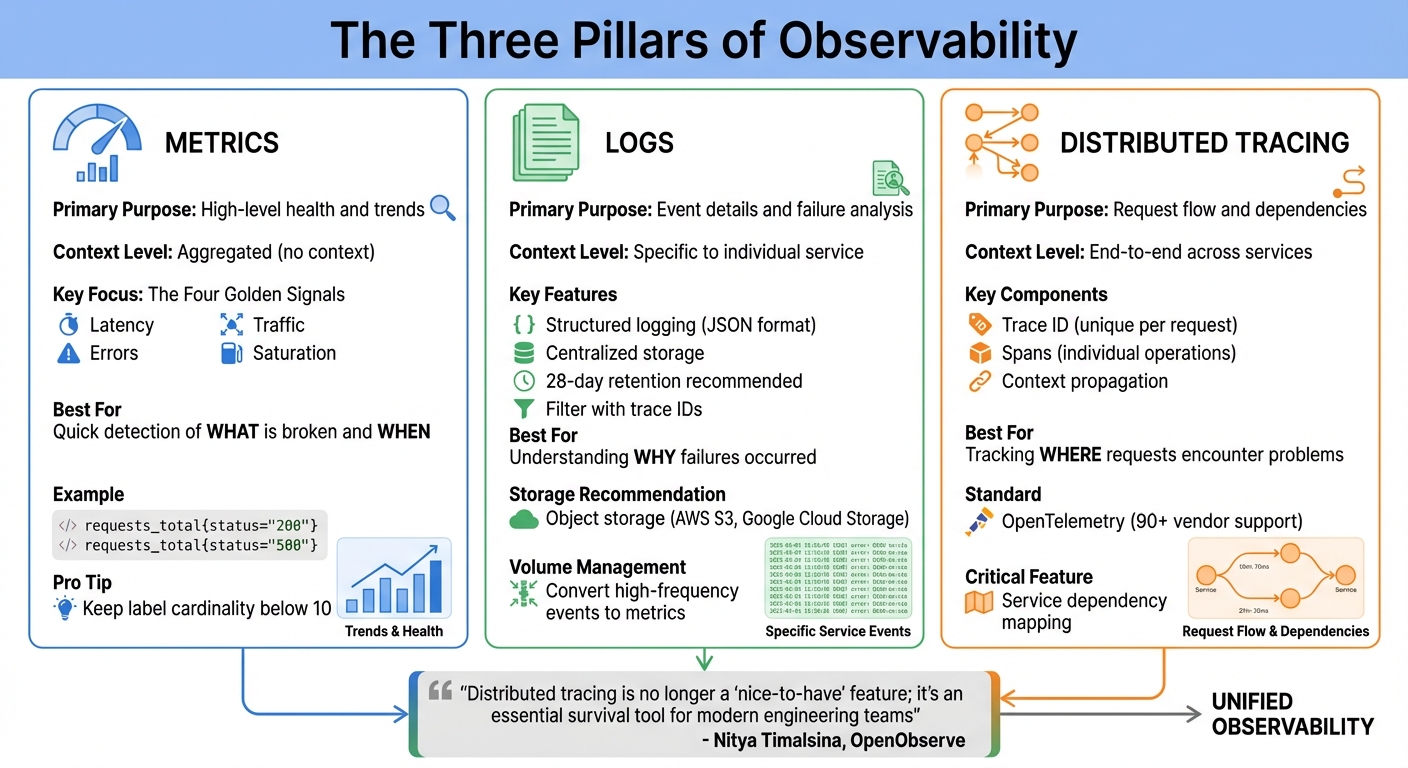
Three Pillars of Distributed Systems Observability: Metrics, Logs, and Traces
Observability is what sets apart teams that scramble during outages from those that resolve issues swiftly. For smaller teams, the challenge lies in building observability without wasting resources or drowning in data. The good news? You don’t need a massive enterprise setup to gain meaningful insights into your distributed system. Instead, focus on the essentials: metrics, logs, and traces. These three signals are the backbone of an efficient and cost-effective observability strategy.
Each of these signals offers a unique perspective on your system’s behavior. Metrics reveal what is broken and when it needs attention. Logs provide the detailed information necessary to pinpoint specific issues. Traces, on the other hand, show where a request encountered problems as it moved through multiple services. Together, they form a comprehensive picture of your system’s health. As Rob Ewaschuk from Google’s SRE team explains:
"The four golden signals of monitoring are latency, traffic, errors, and saturation. If you can only measure four metrics of your user-facing system, focus on these four".
Metrics: Tracking Key Performance Indicators
Metrics are your first line of defense in monitoring system health. By keeping an eye on latency, traffic, errors, and saturation, you can gauge performance without overloading your infrastructure.
To avoid unnecessary resource usage, limit label cardinality - the number of unique label combinations in your metrics. Each unique set creates a new time series, consuming memory, processing power, and storage. Aim to keep cardinality below 10 and steer clear of highly unique values like user IDs or session tokens. Instead, instrument common libraries to automatically capture data from multiple service-to-service interactions.
Another tip: reduce log volumes by converting high-frequency events into metrics. For instance, instead of logging every HTTP request, export them as counters like requests_total{status="200"} or requests_total{status="500"}. This approach provides the same insights while cutting storage costs significantly. As the Prometheus documentation advises: "For every line of logging code, you should also have a counter that is incremented".
Once you’ve established metrics, it’s time to dive into logs for detailed failure analysis.
Centralized Logging for Small Teams
Logs are indispensable for debugging, but they can quickly become overwhelming and expensive to manage. The solution? Centralized logging with smart filtering. Tools like Fluent Bit can filter, transform, and send logs from each node to a central store, reducing ingestion costs. For smaller environments, Grafana Loki’s monolithic mode is a great option. It’s lightweight, easy to deploy, and can handle up to 20GB of logs per day - enough for most small production setups.
Using structured logging (e.g., JSON format) makes logs easier to query and correlate with traces. For storage, object storage solutions like AWS S3 or Google Cloud Storage are more cost-effective and manageable than local filesystems. Define retention periods, such as 28 days (retention_period: 672h), to automate storage management. If infrastructure management isn’t your thing, Grafana Cloud’s free tier offers 50GB each for logs and traces, which is often sufficient for small-scale production needs.
With logs under control, distributed tracing ties everything together.
Distributed Tracing: Connecting the Pieces
Distributed tracing allows you to follow a request as it flows through your system, showing where time is spent and where failures occur. Each trace is made up of spans, which represent individual tasks like API calls or database queries. These spans include metadata such as HTTP methods, status codes, and custom attributes.
The go-to standard for tracing is OpenTelemetry (OTel), supported by over 90 vendors. It’s a flexible, vendor-neutral solution that prevents lock-in. To get started quickly, use auto-instrumentation to monitor common frameworks and libraries with minimal setup. For example, auto-instrumenting your HTTP server and database client can immediately provide insights into request latency and backend performance.
When implementing tracing, prioritize critical user journeys like login or checkout flows rather than trying to instrument everything at once. Ensure context propagation is working properly - trace IDs must flow between services to maintain trace continuity. For processing and exporting traces, deploy an OTel Collector, which can also handle tasks like redacting sensitive data or sampling.
By incorporating tracing into your observability stack, you gain the ability to diagnose and resolve complex issues with confidence.
Here’s a quick comparison of the three pillars of debugging:
| Signal | Primary Purpose | Context |
|---|---|---|
| Metrics | High-level health and trends | Aggregated (no context) |
| Logs | Event details | Specific to individual service |
| Distributed Tracing | Request flow and dependencies | End-to-end across services |
As Nitya Timalsina, Developer Advocate at OpenObserve, notes:
"Distributed tracing is no longer a 'nice-to-have' feature; it's an essential survival tool for modern engineering teams".
With metrics, logs, and traces working together, your team will be well-equipped to tackle even the most complex distributed systems.
Root Cause Analysis with Tracing and Correlation
Let’s dive deeper into resolving system issues by building on the concepts of metrics, logs, and traces. Once you’ve achieved observability, the next challenge is pinpointing the root cause of problems. This is where distributed tracing becomes invaluable. Every request is assigned a unique Trace ID, and each operation within that request is represented as a span with its own ID. This setup allows you to track a request as it moves through various services, giving you a clear picture of its journey.
Traces help you understand where time was spent and which services were involved, while logs provide insight into the why behind failures. By injecting trace IDs into log messages, you can filter all logs related to a specific request across your system. As the OpenTelemetry documentation explains:
"An application is properly instrumented when developers don't need to add more instrumentation to troubleshoot an issue, because they have all of the information they need".
To investigate issues effectively, start with a breadth-first approach. Begin by reviewing high-level metrics like latency and error rates to identify the problematic component, then drill down into traces and logs for more details. This method ensures you focus on the right areas without wasting time on unrelated services. For example, in 2019, Google’s SRE team resolved a major production issue where front-end servers were returning 500 errors. By analyzing time-series metrics, they quickly identified a back-end dependency causing the problem. Logs and traces confirmed that a new line of code was at fault, and the team mitigated the issue within 20 minutes by rolling back to a stable version.
With tracing in place, the next sections focus on specific tools and techniques to diagnose and resolve performance issues.
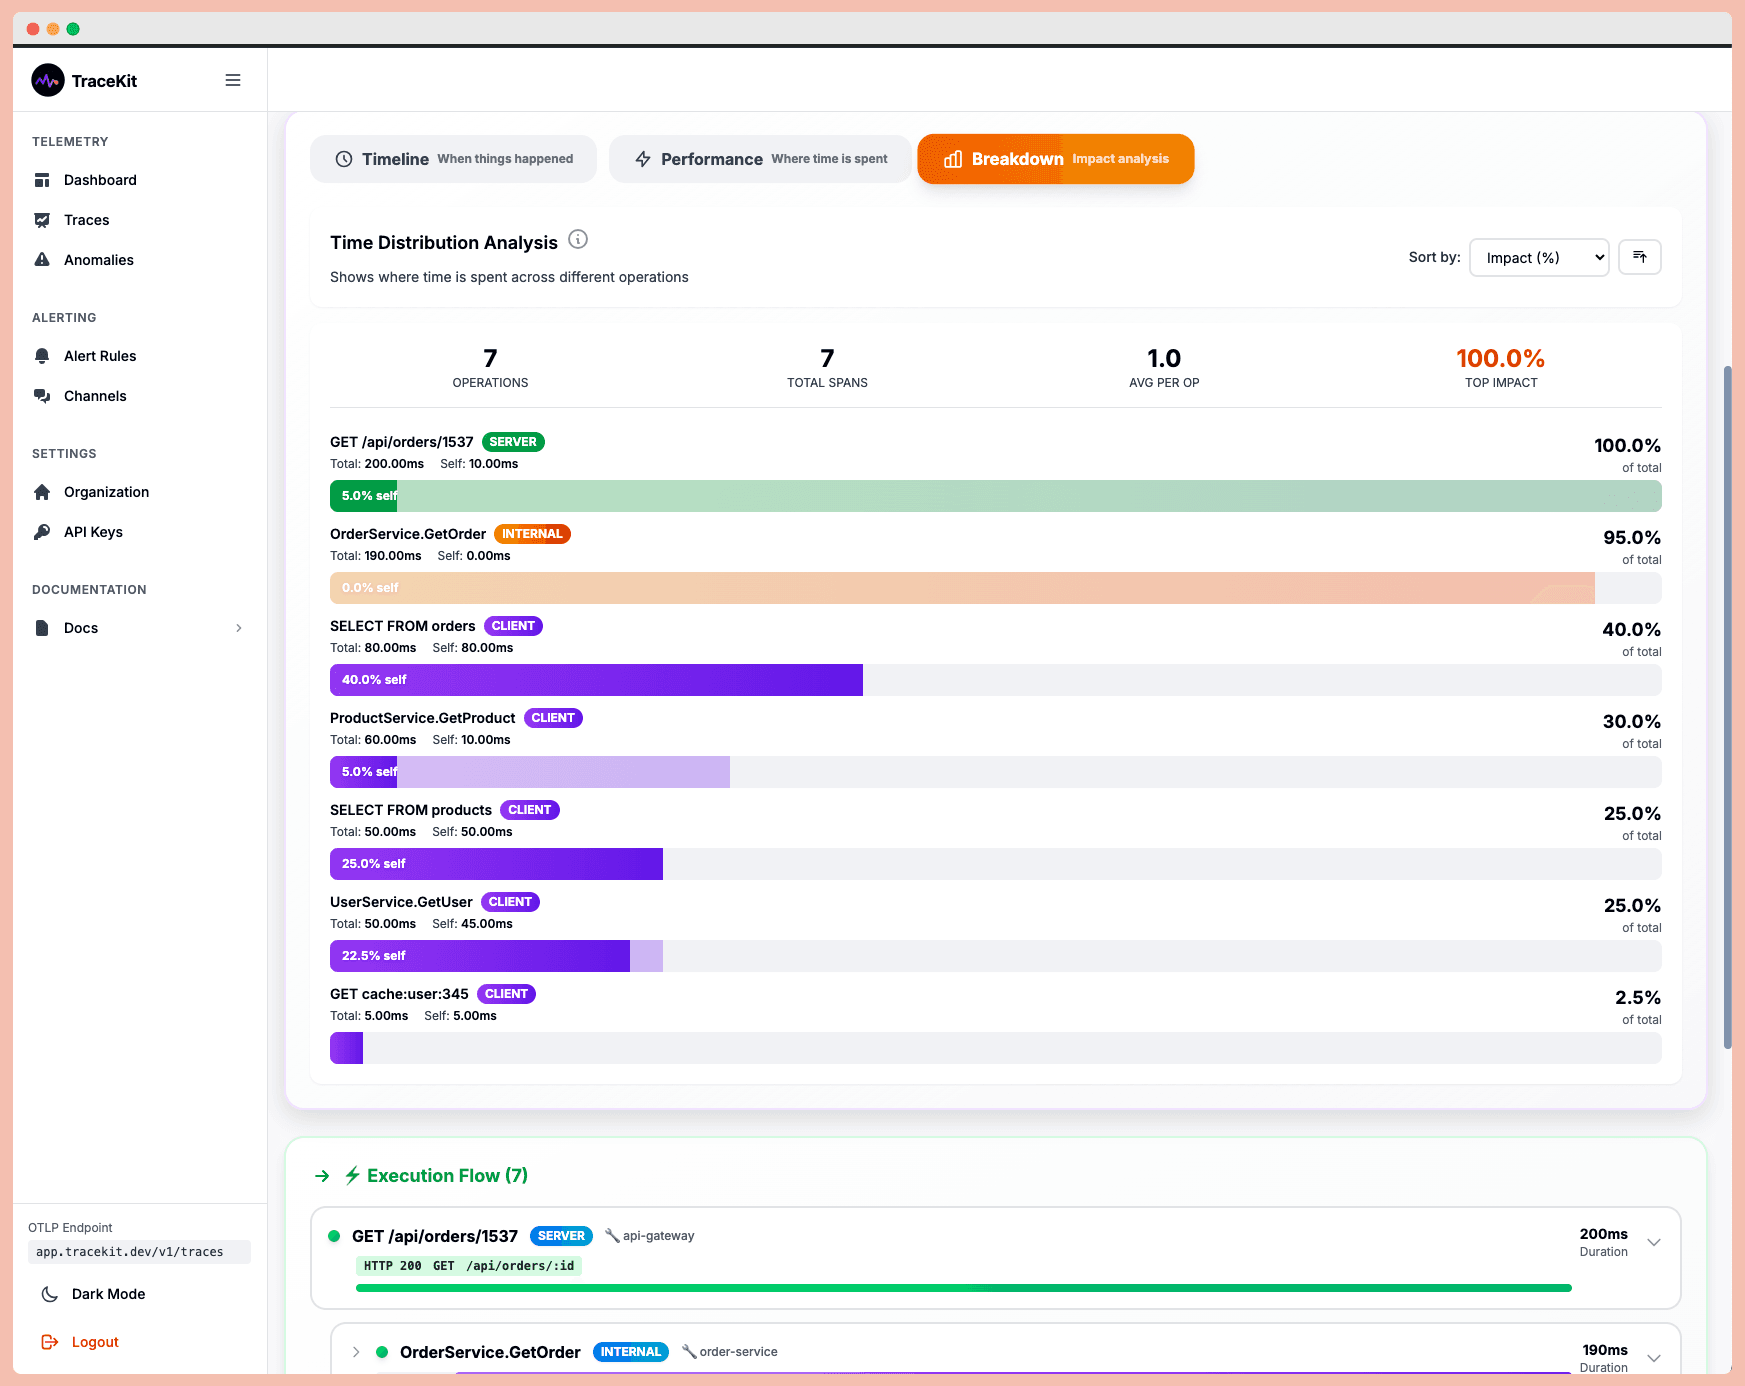
Using Flame Graphs to Find Bottlenecks
Flame graphs are a powerful tool for visualizing the relationships between parent and child spans. The width of each span represents the time spent on a specific service or database query. This makes it easy to identify bottlenecks - just look for the widest spans.
These graphs are particularly useful for spotting issues like "slow-performing service combinations" or "noisy neighbor effects", where one service’s poor performance impacts others. For smaller teams, flame graphs save time by highlighting areas for optimization without requiring manual analysis of hundreds of spans.
Linking Traces to Logs and Errors
The true strength of distributed tracing lies in linking traces to logs and errors. By configuring your logging library to include the current trace_id in every log message, you can streamline your debugging process. Encounter an error? With the trace ID, you can instantly pull up all related logs across every service involved in that request.
Error linking takes this a step further by attaching error reports directly to the span where the failure occurred. Metadata like trace_id and span_id ensures you know exactly where things went wrong. As New Relic puts it:
"Distributed tracing acts as a powerful debugging tool. Developers can trace a specific request or transaction, analyze the associated logs, and quickly identify the source of errors".
For systems with heavy traffic, tail-based sampling ensures that traces with errors or unusual slowness are always retained, even if successful traces are sampled out. This ensures you don’t lose critical failure data in the noise of normal operations.
Mapping Service Dependencies
Service dependency maps are automatically generated from trace data and provide a real-time view of how services interact. These maps are invaluable for understanding failure points and uncovering undocumented dependencies. When a service fails, the map shows exactly which other services are affected and whether the failure causes a total system outage or just partial degradation.
For smaller teams, focus first on mapping hard dependencies in your critical paths - these are the services where a failure would bring down your entire system.
To keep traces connected across service boundaries, adopt the W3C Trace Context standard. This standard uses HTTP headers (traceparent and tracestate) to pass tracking information, preventing "broken traces" when requests move between different vendors or middleware. As Nitya Timalsina from OpenObserve emphasizes:
"Distributed tracing is no longer a 'nice-to-have' feature; it's an essential survival tool for modern engineering teams".
To stay proactive, consider establishing a regular review routine - like a "Trace Tuesday" - where your team examines the slowest 1% of traces to identify potential problems before they escalate. This approach helps you stay ahead of issues instead of constantly firefighting.
AI-Powered Observability for Debugging
Building on the basics of metrics, logs, and traces, AI-powered observability takes debugging to the next level by introducing proactive anomaly detection. Traditional monitoring systems are great at letting you know something has gone wrong. But AI-powered tools go a step further - they identify what broke, where it broke, and why it broke, often catching issues before users even notice. This shift from reactive problem-solving to proactive maintenance is a game-changer, especially for smaller teams with limited resources.
The secret lies in pattern recognition. AI thrives on structured input, like detailed distributed traces that capture timing, dependencies, and error states. With this data, AI tools can accurately assess causality, helping teams address problems before they disrupt users. As debugg.ai aptly puts it:
"The future of debugging is not more chat. It is more proof. LLMs are useful copilots, but without structured observations they are guessing".
Real-Time Anomaly Detection and Alerts
One of the standout features of AI-powered observability is its ability to cut through the noise with real-time anomaly detection. Rob Ewaschuk from Google's SRE team highlights the importance of prioritizing alerts:
"Every time the pager goes off, I should be able to react with a sense of urgency. I can only react with a sense of urgency a few times a day before I become fatigued".
AI-driven alerts focus on what truly matters - urgent, actionable issues that directly affect users. By learning normal traffic patterns, AI can identify significant deviations and minimize false alarms. This approach ensures your team can focus on solving real problems. And for recurring issues that trigger repeat alerts? Those should be automated, freeing up your team to focus on more critical tasks.
Dynamic Logs in Production with TraceKit
Debugging production systems can be tricky, but dynamic logs makes it possible to inspect running code without stopping or redeploying your application. When an issue arises, you can add a log point on a specific line of code and capture critical details - like variable state, stack traces, and request context - when that code executes again.
TraceKit’s dynamic logs feature is particularly useful in distributed systems, where reproducing issues locally is often impossible. By using dynamic instrumentation, TraceKit injects monitoring code at runtime, allowing you to collect the data you need without redeploying or risking untested changes during an active incident.
Automated Root Cause Analysis with AI
AI doesn’t stop at real-time monitoring - it also simplifies the root cause analysis (RCA) process. AI-powered RCA automates the tedious task of correlating logs, traces, and metrics. For example, it can group related failures and uncover connections between errors across microservices that might otherwise seem unrelated. A common scenario? A database timeout causing cascading issues across your system.
Here’s a real-world example: in a small e-commerce API, AI-driven RCA cut investigation time from 1–2 hours to just 20 minutes. It pinpointed the root cause - a slow database query affecting checkout flow - saving the team from hours of manual troubleshooting. As Multiplayer emphasizes:
"The quality of AI output is directly tied to the quality of the input, and AI cannot invent missing context".
This highlights the importance of comprehensive instrumentation. Tools like TraceKit make this easy by automatically capturing distributed traces, linking them with logs and errors, and presenting full request context - including user sessions and database queries.
For small teams, the payoff is huge. Instead of spending hours hunting through logs and guessing at correlations, you get a prioritized list of likely root causes backed by concrete trace data. While AI doesn’t replace human expertise, it handles much of the repetitive diagnostic work, allowing your team to focus on solving the problem.
Practical Debugging Workflows for Small Teams
Debugging distributed systems can feel like untangling a web, but having a clear plan makes all the difference. The first step? Triage the situation before diving into root-cause analysis. As Chris Jones from Google's SRE team aptly advises:
"Stopping the bleeding should be your first priority; you aren't helping your users if the system dies while you're root-causing."
When something breaks in production, your top priority is to get the system back up and running for users. This might mean rolling back a deployment, redirecting traffic, or temporarily disabling a non-essential feature. Once stability is restored, you can dig into the issue without the added stress of an active outage. Below are practical workflows to help you restore service efficiently while keeping long-term performance in mind.
Chaos Testing and Fault Injection on a Budget
After stabilizing your system, the next step is to test its ability to handle failures. Chaos testing is a great way to ensure your observability tools work when things go wrong. Even small teams can conduct fault injection tests in staging environments by simulating issues like network delays, database connection drops, or service outages. These tests help confirm that your distributed traces capture failures accurately and that context is properly carried across service boundaries.
Chaos testing also highlights blind spots in your monitoring setup. For example, if a simulated database timeout doesn’t trigger an alert or show up in your traces, it’s a clear sign that your instrumentation needs improvement. By testing one failure scenario each week, you can gradually strengthen your system’s resilience and reduce surprises during real incidents.
Performance Optimization Using Trace Data
Tracing tools can do more than troubleshoot - they’re also invaluable for spotting performance bottlenecks. Flame graphs, in particular, are excellent for identifying CPU-intensive code paths. To stay ahead of performance issues, consider setting up a recurring "Trace Tuesday" review. During these sessions, use flame graphs to identify slow services or resource-heavy functions.
For example, if the same endpoint frequently appears among the slowest traces, it’s a clear candidate for optimization. Tools like TraceKit make this process easier by offering flame graphs and waterfall visualizations that clearly show where time is being spent across your system. Early detection and regular reviews can prevent small inefficiencies from snowballing into major problems.
Monitoring Database Queries and User Sessions
Database performance often hides behind the scenes but can be a major cause of slow requests. Tracking full SQL statements in your traces can reveal issues like missing indexes or inefficient N+1 query patterns that worsen with increased traffic. TraceKit simplifies this by automatically capturing full SQL statements, making it easier to identify which queries are causing delays.
Adding user session context to your traces - such as customer ID, location, or feature usage - can turn vague complaints into actionable data. For instance, if users from a specific region report slow checkout times, filtering traces by location can help pinpoint whether a particular database or service is introducing latency.
When monitoring, keep an eye on the Four Golden Signals: Latency, Traffic, Errors, and Saturation. These metrics are your first line of defense when diagnosing issues. Is latency spiking? Are error rates climbing? Is a service running out of memory? These signals help you quickly narrow down the problem before diving into logs or traces. By focusing on these core indicators, you can efficiently identify and address performance issues.
Affordable Debugging Tools for Small Teams
When it comes to debugging tools, small teams face the challenge of finding solutions that are both effective and budget-friendly. Tools built on OpenTelemetry offer enterprise-level features at a fraction of the cost - about 20% of what legacy providers charge.
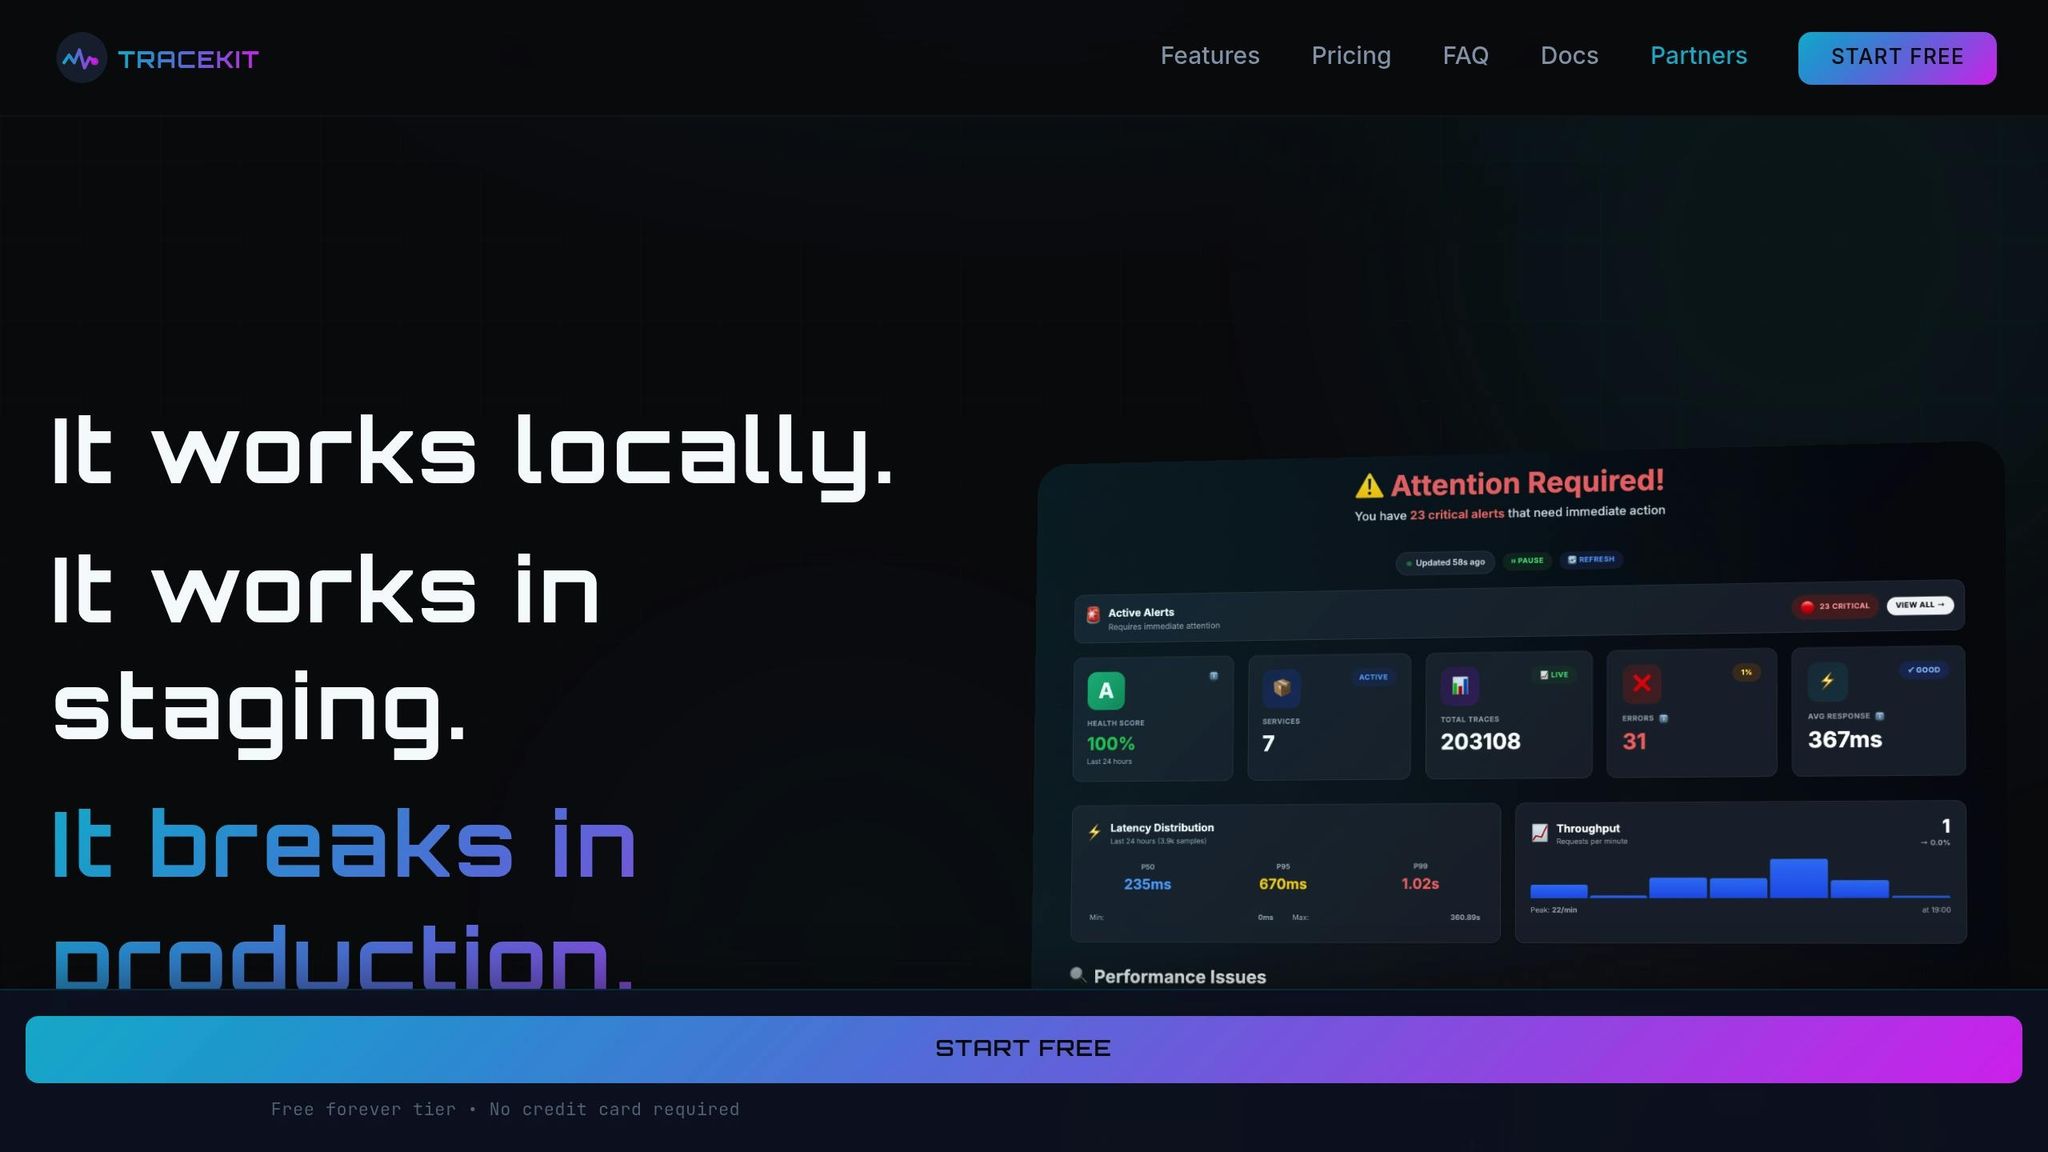
Zero-Configuration Setup with TraceKit
TraceKit removes the usual setup headaches that can bog down small teams. With just a single line of code, you can get up and running in as little as five minutes. This means instant visibility into your application stack, without the hassle of manual configuration.
Sarah Lindqvist, VP of Engineering at a Series B SaaS company, shared her experience:
"Finally, an observability tool that doesn't require a dedicated team to manage. We went from zero visibility to full distributed tracing in under a day."
This no-fuss setup allows your team to focus on solving bugs instead of wrestling with tool configurations. TraceKit supports a wide range of popular stacks, including PHP, Node.js, Go, Python, Java, and Ruby. It even provides ready-to-use tracing for frameworks like Laravel and Express, with no custom code required.
Pricing Plans for Different Traffic Levels
Once setup is simplified, the next priority is clear pricing. TraceKit’s pricing is based on the number of traces ingested per month, avoiding per-seat or per-host fees.
- Starter Plan ($29/month): Includes 1 million traces per month with 30-day retention, ideal for teams handling around 100,000 requests daily.
- Growth Plan ($99/month): Offers 10 million traces per month, suitable for approximately 1 million daily requests.
- Pro Plan ($299/month): Designed for high-traffic applications, it supports 50 million traces per month with 180-day retention and dedicated support, covering around 5 million requests daily.
All plans come with unlimited team members, services, and metrics, ensuring no hidden costs as your infrastructure scales. Starter includes email support, while Growth and Pro plans provide priority and dedicated support.
TraceKit Plans and Features Comparison
| Plan | Price | Traces/Month | Retention | Best For | Support Level |
|---|---|---|---|---|---|
| Starter | $29/month | 1M | 30 days | ~100K requests/day | |
| Growth | $99/month | 10M | 30 days | ~1M requests/day | Priority |
| Pro | $299/month | 50M | 180 days | ~5M requests/day | Dedicated + SLA |
Every plan includes advanced features like dynamic logs, distributed tracing, flame graphs, service dependency maps, AI-driven anomaly detection, and automatic error linking. There’s no feature limitation - whether you’re on the Starter or Pro plan, you get the full suite of debugging capabilities, tailored to your production needs.
James Okonkwo, Platform Lead at an e-commerce company, highlighted the value of this approach:
"The pricing model is transparent. We know exactly what we'll pay each month, and the performance at scale has been rock solid across 200+ services."
Conclusion: Debugging Distributed Systems Effectively
Tackling the challenges of debugging distributed systems doesn’t have to feel overwhelming, even for smaller teams. The key lies in blending efficient observability with smart automation. Start with a strong foundation of observability: use metrics for quick issue detection, distributed tracing to map request flows, and centralized logging to dig into the details. Correlation IDs can help you weave together the story of each request, while OpenTelemetry offers a flexible, cost-effective way to avoid being tied to a single vendor.
When something goes wrong, focus on triage first. Stabilize the system - whether that means rolling back changes or redirecting traffic - before diving into root cause analysis. Tools like flame graphs and service dependency maps are invaluable here. For instance, Dan Mindru used trace visualization to pinpoint bottlenecks, reducing a single API call’s response time by 22.3 seconds - a clear example of how the right tools can drive real improvements.
Beyond observability, automation and standardization can dramatically speed up debugging. AI-driven anomaly detection can alert you to issues before they spiral, while dynamic logs let you capture variable state in production code without redeploying. OpenTelemetry’s auto-instrumentation capabilities also make it possible to gain visibility in minutes rather than weeks.
Focus your efforts on the most critical parts of your system, like user journeys for checkout, login, or payment. Regularly review trace data to spot inefficiencies and manage storage costs effectively. Tail-based sampling is another smart way to balance cost and data retention, ensuring you capture what’s essential without overspending.
To wrap it up, keep your debugging workflows simple and prioritize visibility at every step. Teams that focus on clarity and the right tools can handle even sprawling systems with ease. The goal is straightforward: maintain a stable, fast, and reliable application that keeps your users happy.
FAQs
How can small teams implement observability without straining their resources?
Observability helps teams figure out why a system behaves the way it does - without having to dig into its inner workings. For smaller teams, a practical starting point is to focus on the four SRE 'golden signals': latency, traffic, errors, and saturation. These metrics give a clear, high-level snapshot of system health without the need for complex logging or full-stack tracing. Start by instrumenting the critical request paths to generate these signals, keeping the setup simple and easy to manage.
When it comes to collecting these signals in a cost-effective way, OpenTelemetry is a solid choice. This open-source standard supports traces, metrics, and logs, making it a versatile tool. To manage data volume and storage costs, enable sampling - capturing, for example, just 1% of requests. Even with reduced sampling, tools like Prometheus for metrics and a basic backend for traces can provide valuable insights. Distributed tracing, even at lower sample rates, can significantly cut down mean-time-to-repair (MTTR) by showing how requests move through your services.
Take an incremental approach to observability. Start small by focusing on one service, fine-tune alerts to ensure they highlight real problems, and gradually expand your coverage. For better efficiency, consolidate metrics, logs, and traces into a single dashboard to get a unified view of your system. Rotating data retention policies can also help keep storage costs under control. This step-by-step method allows small teams to gain actionable insights without stretching their resources or breaking the bank.
How does AI simplify debugging in distributed systems?
AI takes the heavy lifting out of debugging in distributed systems by automating intricate tasks. It can detect anomalies, connect the dots between logs, metrics, and traces, and even zero in on potential root causes. This slashes the mean time to resolution (MTTR) and spares engineers from the tedious job of combing through endless logs, letting them concentrate on resolving critical issues instead.
What’s more, AI boosts debugging precision by offering actionable and testable solutions. Paired with tools like distributed tracing and sandboxed reproductions, AI can validate its own suggestions, transforming educated guesses into dependable fixes. This not only minimizes guesswork but also eases mental fatigue, allowing smaller teams to keep systems running smoothly without the burden of manual troubleshooting.
How does distributed tracing help identify the root cause of issues in complex systems?
Distributed tracing offers a clear, detailed picture of how a request moves through your system. It does this by tracking the entire call chain, complete with timestamps and unique identifiers. This level of visibility makes it much simpler to identify where delays or errors are happening - whether it's within a specific service or during interactions between services.
This approach not only cuts down the time spent on debugging but also helps teams grasp system dependencies and locate performance bottlenecks more effectively. In complex distributed systems, it streamlines root cause analysis, enabling quicker and more precise problem-solving.
Related Blog Posts
Related Posts
Your API Just Threw a 500. Here's How to Actually Fix It.
Your API threw a 500 at 3 AM. A systematic approach to diagnose, trace, and fix production API errors without the panic and guesswork.
Debug Production Issues 10x Faster with Tracing
Debug production issues 10x faster with distributed tracing. Track requests across microservices, find bottlenecks, and resolve errors without log diving.

Fix Intermittent 500 Errors: A Systematic Approach
Fix intermittent 500 errors systematically. Reproduce, investigate logs, trace requests, and capture application state to find the root cause.