How to Debug Production APIs Without Logs
Debug production APIs without relying on logs. Use distributed tracing, dynamic logs, and AI anomaly detection to find root causes 70% faster.

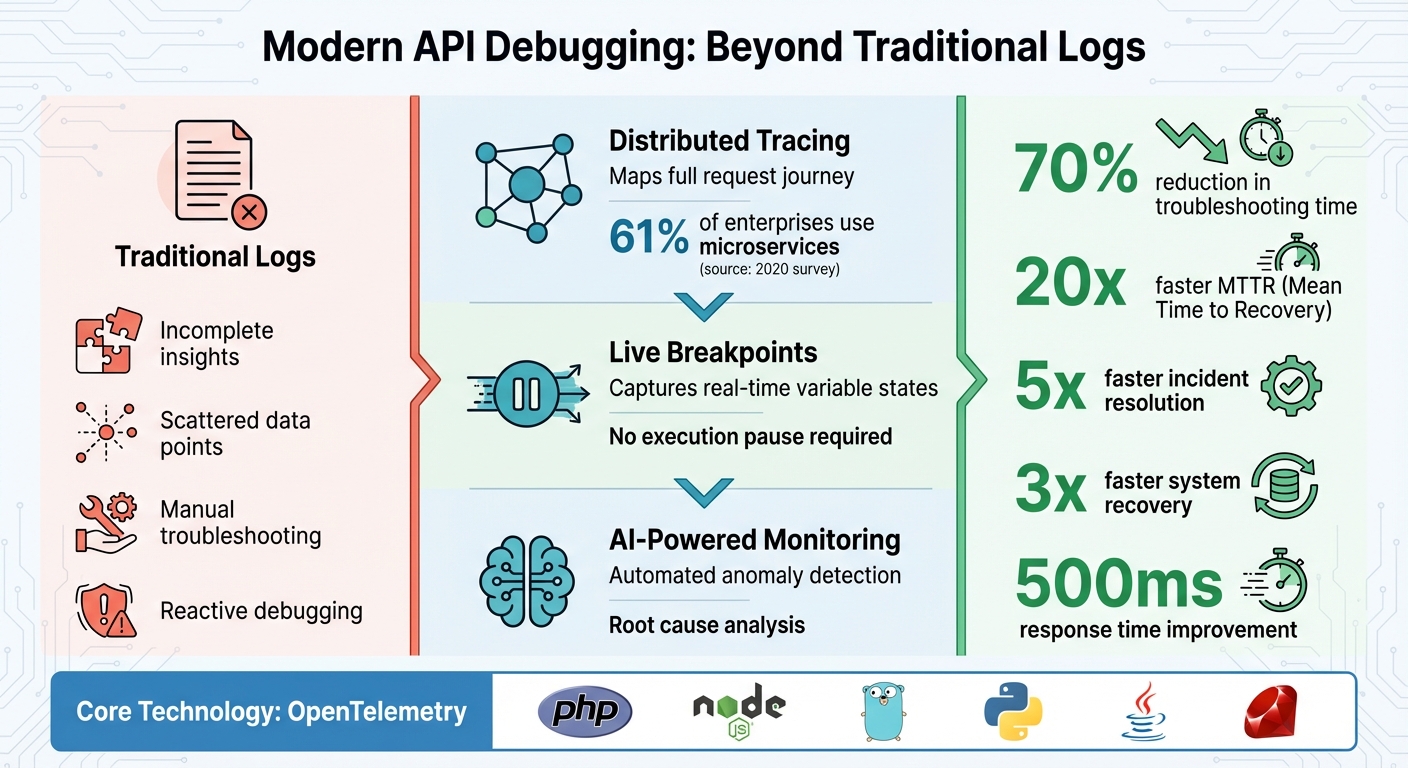
When your production API fails, traditional logs often fall short, offering incomplete insights and leaving you scrambling for answers. Modern debugging techniques, like distributed tracing, dynamic logs, and AI-powered anomaly detection, provide a complete picture of what went wrong - without relying on logs. These methods help track requests across microservices, capture variable states in real time, and identify issues automatically, reducing troubleshooting time by up to 70%.
Key Takeaways:
- Distributed Tracing: Maps the full journey of a request, highlighting errors and bottlenecks.
- Dynamic Logs: Captures real-time variable states without pausing execution.
- AI Monitoring: Flags anomalies and automates root cause analysis.
- OpenTelemetry: A standard framework for collecting telemetry data across languages and platforms.
By making your system observable with tools like OpenTelemetry and TraceKit, you can debug faster, improve API performance, and reduce downtime.
Traditional Logging vs Modern API Debugging Methods Comparison
How to debug in 2025: logs, traces, and metrics
Setting Up for Debugging Without Logs
To debug production APIs effectively without relying on logs, you first need to make your system observable. This involves setting up your code to emit traces, metrics, and contextual data that reveal internal operations. Thankfully, modern tools make this process much easier. Establishing this kind of observability is critical for the advanced debugging methods covered later.
Requirements for Observability
At the heart of debugging without logs is OpenTelemetry (OTel). This open-source framework has become the go-to standard for collecting telemetry data. It offers unified APIs and SDKs for popular programming languages like PHP, Node.js, Go, Python, Java, and Ruby - covering the platforms most commonly used for production APIs. OpenTelemetry's open standards also ensure you aren’t locked into any single vendor. As the Dash0 team explains:
"The future of observability is open, composable, and cost-effective. It's built on standards like OpenTelemetry and PromQL and doesn't force you into a proprietary black box."
When it comes to instrumentation, you have two options:
- Zero-code (automatic) instrumentation: This approach uses agents or extensions to gather telemetry data from your libraries and frameworks without modifying your code. For example, if you’re using PHP 8.0 or later, you can enable the OpenTelemetry PECL extension and set environment variables like
OTEL_PHP_AUTOLOAD_ENABLED=trueto automatically capture HTTP requests, database queries, and external API calls. - Code-based (manual) instrumentation: This method requires integrating SDKs directly into your code to create custom spans and attach detailed metadata. If you’re working with PHP 7.4 or earlier, manual instrumentation is your only option.
Instrumentation Best Practices
Once you’ve selected your observability framework, follow these guidelines to ensure your telemetry data is both useful and reliable.
Start by instrumenting your primary RPC or web framework, such as Laravel for PHP or Express for Node.js. This will capture the most critical transaction paths in your application.
Context propagation is essential for distributed tracing. It ensures that as a request moves through your system - from the API gateway to various microservices - each span is linked by identifiers like trace_id and span_id. Without proper context propagation, your traces can become fragmented, making debugging much harder.
Additionally, include standard attributes in your spans, such as http.request.method, url.path, http.response.status_code, and server.address. These attributes provide the critical context needed for diagnosing issues. Sticking to OpenTelemetry's semantic conventions ensures consistency across different codebases and platforms, making your telemetry data easier to analyze.
Debugging with Distributed Tracing
Distributed tracing builds on solid observability practices by addressing the limitations of traditional logging. It maps out the entire journey of an API request, showing where time is spent and identifying errors across services. This is especially useful in microservice architectures. In fact, a 2020 survey found that 61% of enterprises use microservices, making distributed tracing a critical tool for maintaining visibility. Let’s look at how to get started with distributed tracing and unlock these insights.
A Trace represents the complete lifecycle of a request, while individual operations - like network calls or database queries - are captured as Spans. Each trace and span has unique IDs, which together create a detailed timeline of the request's path . As the request moves between services, these IDs are passed along using wire protocols.
Setting Up Distributed Tracing
To simplify setup, use auto-instrumentation libraries for popular frameworks like HTTP and gRPC. These tools let you add tracing without modifying your code . Start by instrumenting RPC and web frameworks since they cover critical execution paths.
A phased rollout prevents overwhelming your system. Begin with auto-instrumentation on the most critical RPC and web endpoints (Phase 1). Next, enhance your setup by adding custom attributes and sampling strategies (Phase 2). Finally, fine-tune the system with advanced sampling methods and anomaly detection (Phase 3).
Sampling plays a key role in managing performance impact. To minimize overhead, some tracing providers use default rates as low as 0.0001 (0.01%). There are two main approaches to sampling:
- Head-based sampling: Decides whether to trace a request at the start.
- Tail-based sampling: Analyzes all traces but only retains those with errors or unusual latency .
Benefits of Distributed Tracing
Once implemented, distributed tracing significantly improves your ability to diagnose issues. It provides end-to-end visibility that traditional logs can’t match. Tools like flame graphs or request waterfalls help you quickly spot bottlenecks and errors.
But the benefits go beyond reactive debugging. Distributed tracing also enables proactive optimization. For example, some teams hold regular "Trace Tuesdays" to review the slowest 1% of traces and identify areas for improvement before they become major problems. Additionally, trace data can inform realistic Service Level Objectives (SLOs) by using percentile-based measurements for specific user journeys. By enriching spans with details like deployment versions, A/B test groups, or user segments, you can connect technical performance to its broader business impact.
Using Dynamic Logs in Production
Distributed tracing pinpoints where issues arise, but dynamic logs take it a step further by capturing the state of your code in real time - without stopping your application. Unlike traditional IDE breakpoints that pause execution, dynamic logs (also called snapshot debugging or dynamic instrumentation) gather local variables, function arguments, and full stack traces at a specific line of code, all while your API continues to handle traffic seamlessly. Kay James from Gravitee explains:
"The best debugging tools let developers simulate production environments and data without impacting the live service(s) and, therefore, the consumer experience".
This snapshot-based approach lays the groundwork for understanding how dynamic logs operate.
How Dynamic Logs Work
Dynamic logging works by injecting probes into your running code. When a log point fires, the system captures a detailed snapshot of the application state, including all variable values and the call stack.
To minimize performance impact, you can use conditional log points that activate only under specific conditions. For instance, you might add a log point that fires only for a particular user ID or when a variable reaches a certain value. Another powerful technique is event-driven capture, where debug-level data is temporarily stored in memory and only saved to permanent storage when an error or uncaught exception occurs.
Integrating Dynamic Logs
Once you understand how dynamic logs work, the next step is integrating it into your production workflow. This involves connecting your debugging tool to both your running application and your source code. Most tools include an agent that supports multiple programming languages - like Java, Node.js, and Python - and dynamically inserts log points without altering your codebase.
For precise line mapping, integrate the tool with your source code repository. Whether you use GitHub, GitLab, Bitbucket, or a local filesystem, this connection ensures that running code matches the correct source files. After linking your tool, you can navigate your codebase in the debugging interface and place log points on specific lines. When those lines execute in production, you’ll receive a snapshot packed with the context needed to diagnose the issue.
Dynamic logs complement distributed tracing and real-time monitoring, creating a well-rounded observability strategy for production APIs. Tools like TraceKit offer multi-language support for PHP, Node.js, Go, Python, Java, and Ruby, along with automatic instrumentation for popular frameworks. This lets you set dynamic logs across your entire API stack without manually configuring each service. The snapshots captured by dynamic logs integrate seamlessly with distributed traces, providing both a high-level view of request flows and granular details about variable states at key points in your code.
Real-Time Monitoring and Performance Analysis
Real-time monitoring keeps a constant watch on API performance during live operations, helping identify issues like slowdowns or bottlenecks before they impact users. It focuses on key metrics known as the "Golden Signals" - Traffic, Latency, and Error Rate. These metrics provide an instant snapshot of your API's health. For example, sudden spikes in latency or error rates can quickly highlight problematic areas in your execution flow. By pairing this with tools like distributed tracing and dynamic logs, real-time monitoring becomes a crucial part of maintaining consistent performance and reliability.
Flame Graphs and Request Waterfalls
Flame graphs and request waterfalls turn raw performance data into easy-to-understand visualizations of your API's behavior. With these tools, you can click on a specific span in the waterfall view to see the exact query executed and its average performance. This level of detail helps you pinpoint and fix slow or unpredictable segments, leading to smoother and faster APIs - something users immediately notice.
Given that 61% of enterprises use microservice architectures, as reported in a 2020 O'Reilly survey, tools like flame graphs are indispensable. To make the most of these visualizations, consider using adaptive sampling techniques. For instance, trace all errors and slow requests (anything above the 95th percentile threshold) while sampling successful requests at a lower rate.
Database Query and Performance Metrics
Adding another layer of insight, real-time performance metrics monitor system resources and external dependencies. Keeping an eye on database query times, CPU usage, and memory spikes can help you differentiate between inefficient code and infrastructure issues. For example, high CPU usage often signals the need for auto-scaling. These metrics are collected in short intervals, giving you near-instant feedback on system health.
External dependencies also play a critical role in overall API performance. Real-time monitoring can quickly identify delays in synchronous calls to external APIs, Redis, or message brokers. Setting up timeouts and circuit breakers based on these insights can safeguard your API's performance. A common bottleneck revealed by these metrics is connection pool exhaustion, where web containers struggle to establish connections to the application layer. This issue can often be resolved by scaling up workers or hosts.
AI-Powered Anomaly Detection for APIs
AI-powered anomaly detection takes real-time monitoring to the next level by automating the process of identifying problems - without the need to sift through logs manually.
This technology leverages machine learning to analyze trace and performance data, creating a baseline for what constitutes normal API behavior. When something deviates from this baseline - like a sudden spike in latency or an unexpected increase in error rates - the system flags the issue automatically.
This method addresses a key challenge in modern API management. According to Gartner, AIOps combines big data and machine learning to automate IT operations, including event correlation and anomaly detection. By incorporating AI into operations, organizations have significantly reduced Mean Time to Resolution (MTTR).
Automating Anomaly Alerts
For anomaly alerts to work effectively, your AI tool needs access to detailed telemetry data across your systems. By analyzing historical traffic patterns, response times, and error rates, the AI establishes a dynamic baseline for normal behavior. Once this baseline is set, the tool monitors live traffic and identifies unusual patterns based on context, rather than relying on rigid thresholds. For example, an error rate that’s acceptable during peak traffic hours could indicate a problem during quieter times.
Event correlation plays a crucial role here. When multiple alerts occur at once, the AI groups related events and eliminates duplicate notifications. This streamlines the process, allowing you to focus on resolving the root issue instead of sifting through redundant alerts.
Root Cause Analysis with AI
AI-driven root cause analysis simplifies troubleshooting by correlating signals from service calls, database queries, and external integrations. It pinpoints the source of the issue and, when paired with IT Service Management tools, can even automate remediation steps. For example, some tools allow natural language queries like, "Why is the checkout API slower than last week?" and provide immediate, data-backed answers.
To make the most of this capability, maintain an up-to-date map of your services, databases, and hosts. This ensures that the AI can accurately identify problems and automate tasks like restarting services or scaling resources to resolve issues efficiently.
Debugging APIs with TraceKit
TraceKit brings together advanced debugging tools into one unified platform, making it easier to identify and resolve API issues.
What TraceKit Offers
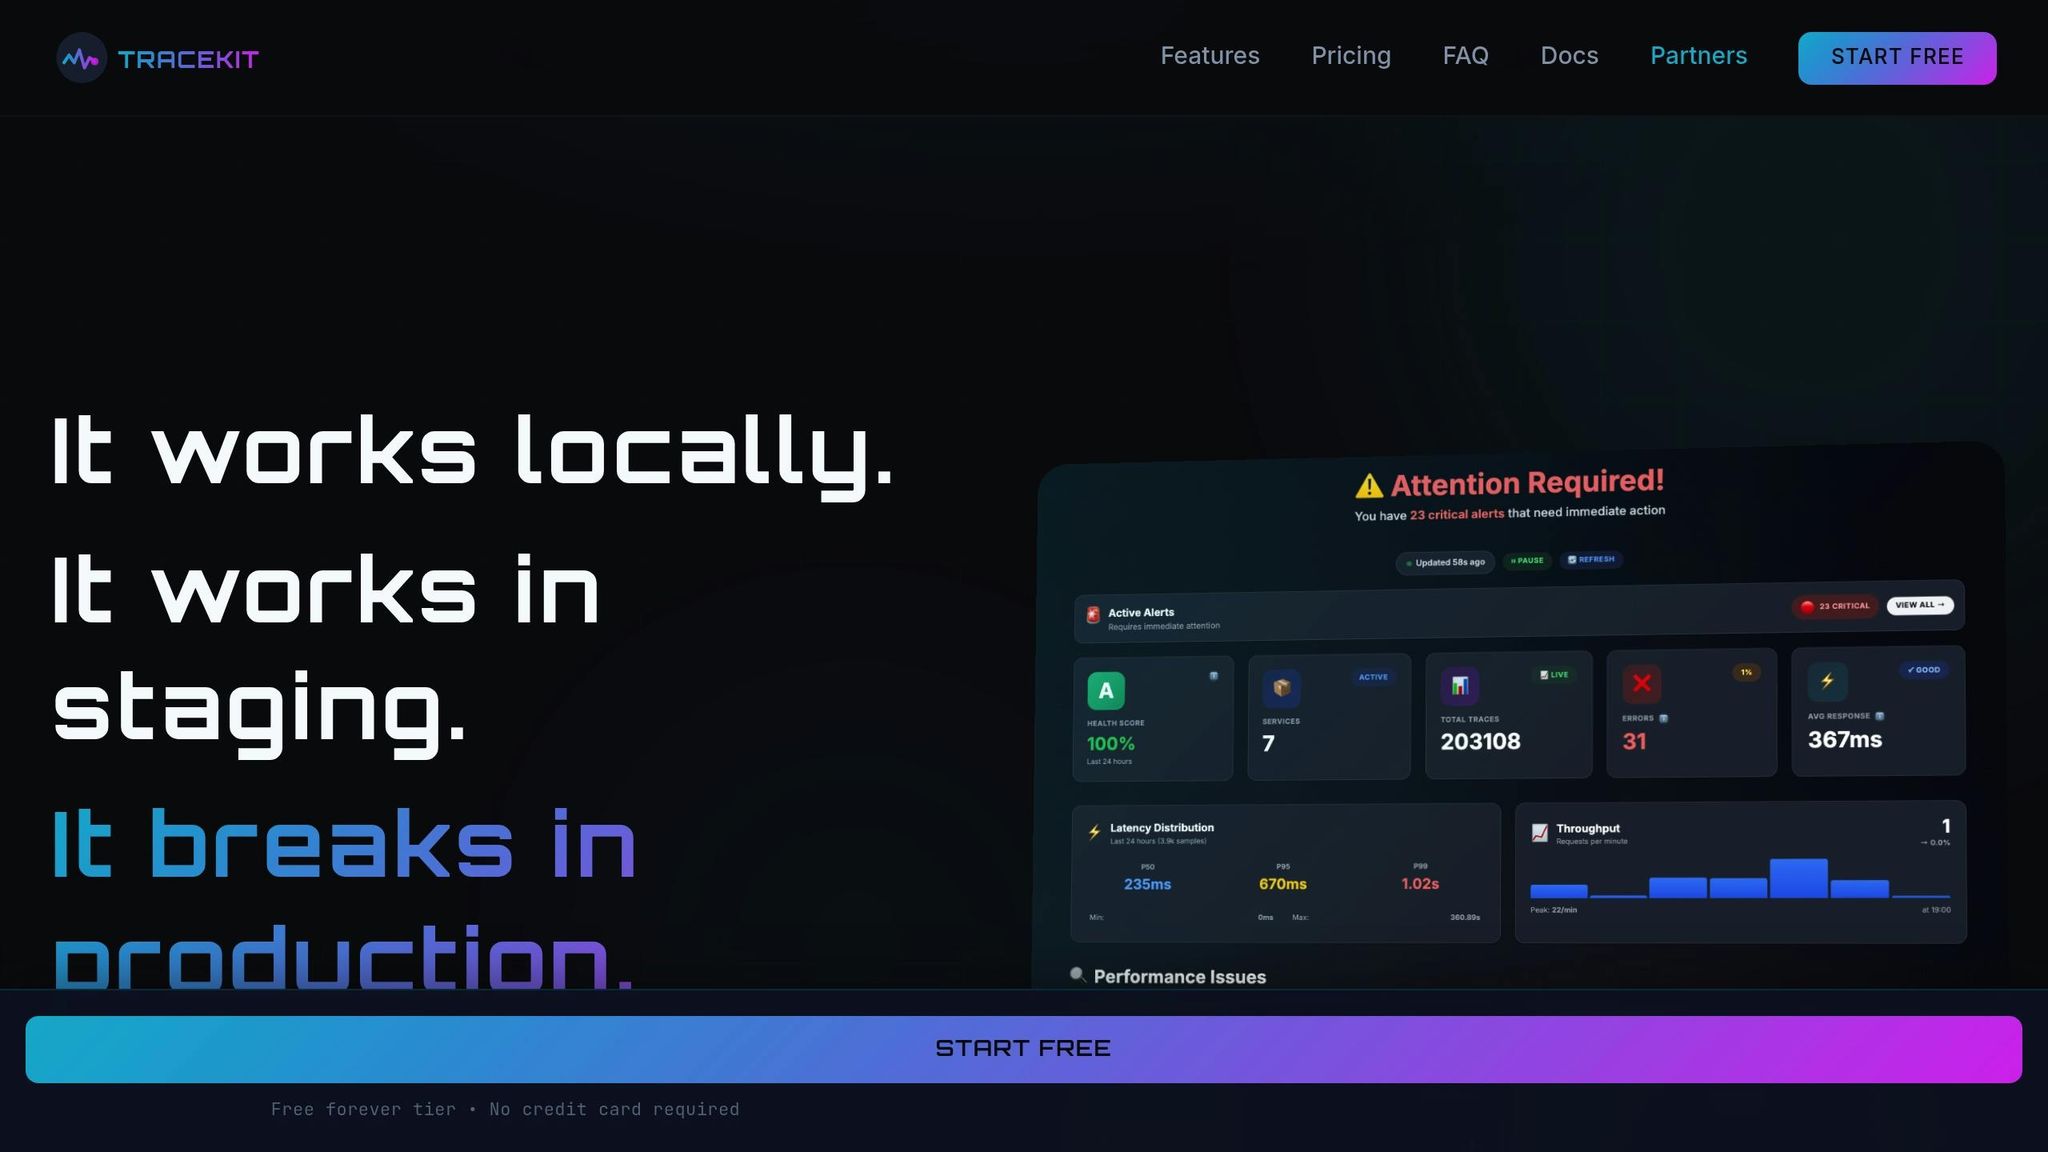
TraceKit combines distributed tracing, dynamic logs, AI-driven anomaly detection, and performance visualization into a single production-ready system.
The platform captures every request without sampling, ensuring no production issue goes unnoticed or untraceable. With its dynamic logs feature, TraceKit lets you capture variable states in real time, enabling in-IDE debugging directly on live traffic - no redeployment required. It also records the entire journey of requests across microservices, detailing the sequence of operations, the components involved, and how long each step takes.
AI agents continuously analyze telemetry data, identifying spikes, sudden changes, and trends that traditional monitoring tools might overlook. The system flags both major and minor changes in internal and third-party APIs, alerting your team before customers encounter any issues.
Teams using TraceKit have reported some impressive outcomes: a 20x faster Mean Time to Recovery (MTTR), a 70% reduction in hands-on debugging, 5x faster incident resolution, and 3x faster system recovery. Additionally, performance insights from the platform have helped shave 500ms off response times for optimized endpoints.
"We had a major incident, and our tech support could see via APItookit which third-party integration partner was responsible, and could take action without needing the engineering team's help."
- Joshua Chinemezum, CEO, Platnova
With these features, TraceKit is designed to fit teams of all sizes, offering straightforward pricing options.
Pricing Details
TraceKit’s pricing is based on trace volume, starting at $29/month:
| Plan | Price | Traces/Month | Retention | Best For |
|---|---|---|---|---|
| Starter | $29/month | 1M traces | 30 days | Small teams (≈100K requests/day) |
| Growth | $99/month | 10M traces | 30 days | Growing teams (≈1M requests/day) |
| Pro | $299/month | 50M traces | 180 days | High-traffic apps (≈5M requests/day) |
All plans include unlimited team members, unlimited services, unlimited metrics, and access to every feature. For those looking to test the waters, TraceKit also offers a free Community Edition with core monitoring features for self-hosting.
Getting Started
Setting up TraceKit is quick and easy. You can sign up using Google, GitHub, or email, then choose your server location and notification preferences. Within minutes, you’ll have API keys for different environments, such as development, staging, and production.
TraceKit supports OpenTelemetry and offers native SDKs for over 17 web frameworks, including:
- Node.js (Express, NestJS)
- Python (Django, FastAPI)
- Go (Gin, Echo)
- PHP (Laravel)
- .NET Core
- Java (Spring Boot)
For supported frameworks, integration requires no configuration. Once the SDK is in place, you can verify your setup using telemetrygen, a tool that generates sample OpenTelemetry data to ensure traces are being sent to the dashboard properly. Once data starts flowing, you can manually acknowledge detected endpoints and anomalies. This step helps train the AI to better understand your API structure for future anomaly detection and OpenAPI spec generation.
To keep your analytics clean, use separate API keys for each environment, ensuring test data doesn’t interfere with production metrics. Before deploying, you can also use telemetrygen to simulate issues like error patterns or latency spikes. This ensures your alerting rules are working as expected and your system is ready for production.
Conclusion
By leveraging distributed tracing, dynamic logs, and AI-powered monitoring, it's possible to debug production APIs without relying on logs. These proactive observability techniques bring a level of precision to debugging that eliminates guesswork and replaces it with actionable insights.
"The future of debugging is not more chat. It is more proof. LLMs are useful copilots, but without structured observations they are guessing." - DebuggAI
This shift in approach turns incident management into a structured process rather than a reactive scramble. Companies adopting these methods have seen impressive results: a 20x faster Mean Time to Recovery (MTTR), a 70% drop in manual troubleshooting efforts, and response times for optimized endpoints reduced by 500ms.
Preparation is the cornerstone of success. Instrumenting APIs with distributed tracing and setting up invariants ahead of time ensures you're ready to tackle unexpected issues. As cloud-native systems grow more complex, addressing "unknown unknowns" becomes a necessity. With the right instrumentation in place, developers have access to all the critical data they need - without scrambling to add new hooks during a crisis.
Start implementing these techniques today to transform reactive troubleshooting into a streamlined, data-driven process. This not only keeps your APIs running smoothly but also frees up your team to focus on creating innovative solutions.
FAQs
How can distributed tracing help debug APIs without relying on logs?
Distributed tracing offers a comprehensive look at how API requests move through your system, tracking their journey and timing across multiple services. This helps you map out the request flow, spot bottlenecks or failures, and zero in on the specific service or component causing issues - without relying solely on traditional logging.
By exposing latency spikes, errors, or unexpected behavior as they happen, distributed tracing empowers engineers to swiftly troubleshoot and fix problems in live environments, reducing potential disruptions for users.
What are the advantages of using dynamic logs to debug production APIs?
Dynamic logging give you the power to pause a running API in a production environment and inspect variables, track code execution, and observe system behavior - all in real time. Instead of relying entirely on log statements, this method offers a faster way to identify and fix issues.
With dynamic logs, you can dive deeper into your API's behavior without interrupting its functionality. This makes it easier to zero in on the root cause of problems and resolve them effectively. It’s particularly helpful when traditional logging falls short or isn’t an option.
How does AI-powered anomaly detection improve API performance monitoring?
AI-driven anomaly detection takes API performance monitoring to a whole new level by spotting unusual patterns or behaviors in real time - even when traditional log data isn't available. These tools can process massive amounts of data at lightning speed, picking up on subtle issues like latency spikes, rising error rates, or strange traffic patterns that manual monitoring might overlook.
This means teams can act faster, cutting downtime and ensuring users enjoy a smooth experience. Instead of wasting time digging through incomplete logs, AI lets you zero in on the problems that matter most.
Related Blog Posts
Related Posts

5 Ways to Debug Production Apps Without Redeploying
Explore five innovative ways to debug production applications in real-time without redeploying, ensuring smooth user experiences.

Laravel Production Debugging: Beyond Logs and Error Tracking
Debug Laravel in production beyond dd() and Log::info(). Use Telescope, dynamic logs, distributed tracing, and performance profiling.

Debug Production Without Redeploying: Step-by-Step Guide
Step-by-step guide to debugging production without redeploying. Set up dynamic logs for PHP, Node.js, Go, and Python in minutes.