Complete Guide to Application Observability for Startups
Practical observability for startups: logs, metrics, traces with OpenTelemetry, cost-saving sampling, AI-driven detection, and CI/CD integration.
Key Takeaways:
- Logs, Metrics, and Traces: These are the three pillars of observability. Logs capture events, metrics track performance, and traces follow user requests across services.
- Cost Management: Use selective data collection and smart retention policies to avoid overspending on monitoring tools.
- AI-Powered Tools: Automate problem detection and root cause analysis to save time and improve efficiency.
- CI/CD Integration: Link observability with your development pipeline to catch issues early and streamline debugging.
Start small, focus on what matters most to your users, and scale your observability as your startup grows. This approach ensures reliability without breaking the bank.
Build An Observability Strategy Your CFO Will Love
The 3 Core Components of Observability
Observability is built on three main pillars - logs, metrics, and traces. Together, they provide a detailed view of how your application behaves, helping you identify issues, understand their impact, and trace their origins. Let’s break down each component to see how they contribute to troubleshooting and problem-solving.
Logs: Capturing Application Events
Logs are like a diary for your application, recording key events such as HTTP requests, database queries, and errors. They also capture details about user actions and the system's state at specific moments [1][2]. When something goes wrong, logs are indispensable for pinpointing the exact cause.
To make the most of logs, use structured formats like JSON and centralize them in a logging system. This approach ensures you can manage the flood of data effectively, especially as your application grows.
Metrics: Monitoring Performance
Metrics are all about numbers - they measure how your system is performing. From tracking response times and error rates to monitoring CPU and memory usage, metrics highlight performance trends and signal potential problems when unexpected spikes or changes occur.
For startups, keeping an eye on critical metrics like API response times, database efficiency, and resource usage is crucial. These insights not only help with capacity planning but also allow for quick identification of performance issues.
Traces: Following Requests Through Services
In microservices architectures, traces follow the path of a request as it moves through various services [1][2]. They log the sequence of operations, their duration, and any delays, offering a clear view of the request's journey.
Distributed tracing is particularly useful for identifying latency problems. By showing where delays occur and how services interact, it helps you uncover bottlenecks and optimize service dependencies.
Creating an Observability Strategy for Small Teams
Startups often face unique challenges when it comes to observability. With limited resources, small teams need a strategy that zeroes in on what truly matters: monitoring the things that directly affect users and the business.
Setting Service-Level Indicators (SLIs) and Objectives (SLOs)
SLIs are metrics that reflect how well your service performs from the perspective of your users. Think of them as your application's "vital signs" - the key numbers that reveal whether users are having a smooth experience or running into issues.
To get started, identify what matters most to your users. For instance:
- If you run an API-driven product, an SLI could be the percentage of requests completed successfully within 500 milliseconds.
- For a web app, it might be the percentage of page loads finishing within 2 seconds.
The idea is to choose metrics that directly tie to user satisfaction.
Once you've nailed down your SLIs, set your SLOs - these are the targets you aim to meet. For example, you might commit to ensuring 99.5% of API requests return successfully within 500ms. These benchmarks help guide your priorities, making it easier to decide when to focus on performance improvements versus building new features.
Keep your SLOs realistic, especially in the early days. Aiming for 99.99% uptime might sound impressive, but it’s costly and often unnecessary for startups. A target like 99.5% or 99.9% uptime is usually enough to maintain user trust while leaving room for routine maintenance and deployments.
With well-defined SLIs and SLOs, you can concentrate your efforts on the services that have the biggest impact.
Deciding Where to Focus First
When you're just getting started with observability, it’s essential to prioritize. Focus on the services that directly affect your users and revenue.
Start by analyzing your traffic patterns. If 80% of your API requests hit three specific endpoints, those should take priority over internal tools that only see occasional use. Similarly, focus on services that have caused incidents in the past or are known to be fragile.
Think about the scope of impact for potential failures. For example, a bug in your email notification system might be frustrating, but an issue in your authentication service could lock out all users. Concentrate your observability efforts on the areas where failures would have the widest consequences.
It’s also wise to focus on services that are particularly challenging to debug. If you’re dealing with a complex data pipeline or a system with multiple external dependencies, improving observability there can save you significant troubleshooting time down the road.
These priorities will help you create targeted alert policies aimed at addressing the most critical issues.
Creating Effective Alert Policies
Alerts should only trigger for problems that require immediate attention. Too many alerts can lead to alert fatigue, where your team starts ignoring them. Too few, and you risk missing critical issues until users report them.
Focus your alerts on user-facing problems. For example, set up notifications for:
- Error rates exceeding a certain threshold (e.g., more than 1% of requests failing).
- Response times going beyond your SLO targets.
- Sudden drops in traffic, which could signal an outage.
Avoid alerting on every single error. Some errors, like a user entering an invalid password or a bot hitting a non-existent URL, are expected and don’t need to wake your on-call engineer at 3 AM. Instead, set alerts for unusual spikes in error rates or failures in key endpoints.
To reduce false positives, use combined condition alerts. For instance, instead of alerting whenever CPU usage exceeds 80%, only trigger an alert if CPU usage stays above 80% for five minutes and response times start to degrade. This approach helps filter out temporary spikes that resolve on their own.
Finally, assign different severity levels to your alerts. Critical alerts - like service outages - should go directly to your on-call rotation via phone or SMS. Less urgent warnings can be sent to Slack or email for review during working hours. This tiered system ensures urgent issues get immediate attention without overwhelming your team with unnecessary noise.
Setting Up Observability in Your Application
After defining your strategy, the next step is integrating observability into your application. Thanks to modern tools, you can set things up quickly, even without a dedicated DevOps team.
Begin with a flexible foundation that works for monoliths, microservices, and serverless architectures. Choose tools that can grow alongside your startup. Let’s dive into how you can effectively deploy these solutions across your diverse architecture.
Using OpenTelemetry for Instrumentation
OpenTelemetry is widely recognized as the go-to framework for collecting observability data. Why? It provides a unified way to instrument applications across different programming languages and observability platforms. One major perk: it separates instrumentation from the backend. Instead of being tied to a specific vendor's SDK, you can instrument your code once with OpenTelemetry and send the data to any compatible platform. This flexibility is invaluable for startups, where tools and requirements often evolve.
Integration is straightforward, especially with auto-instrumentation options for many frameworks. For instance, in a Node.js application using Express, you can install the OpenTelemetry SDK and auto-instrumentation packages, then initialize them with just a few lines of code. This setup automatically tracks HTTP requests, database queries, and other common operations - no need to tweak your application code.
OpenTelemetry also supports other languages like Python, PHP, Java, Go, and Ruby. These auto-instrumentation libraries plug into your framework's lifecycle, generating traces, metrics, and logs with minimal effort. This means you can get basic observability up and running quickly.
The SDK offers detailed control over the data you collect. You can adjust sampling rates to manage trace volumes in high-traffic environments, add custom attributes for more context, and filter out sensitive data before it leaves your application. This level of customization helps you balance visibility, privacy, and costs.
Once instrumentation is in place, you can expand your setup with distributed tracing to capture interactions between services.
Configuring Distributed Tracing
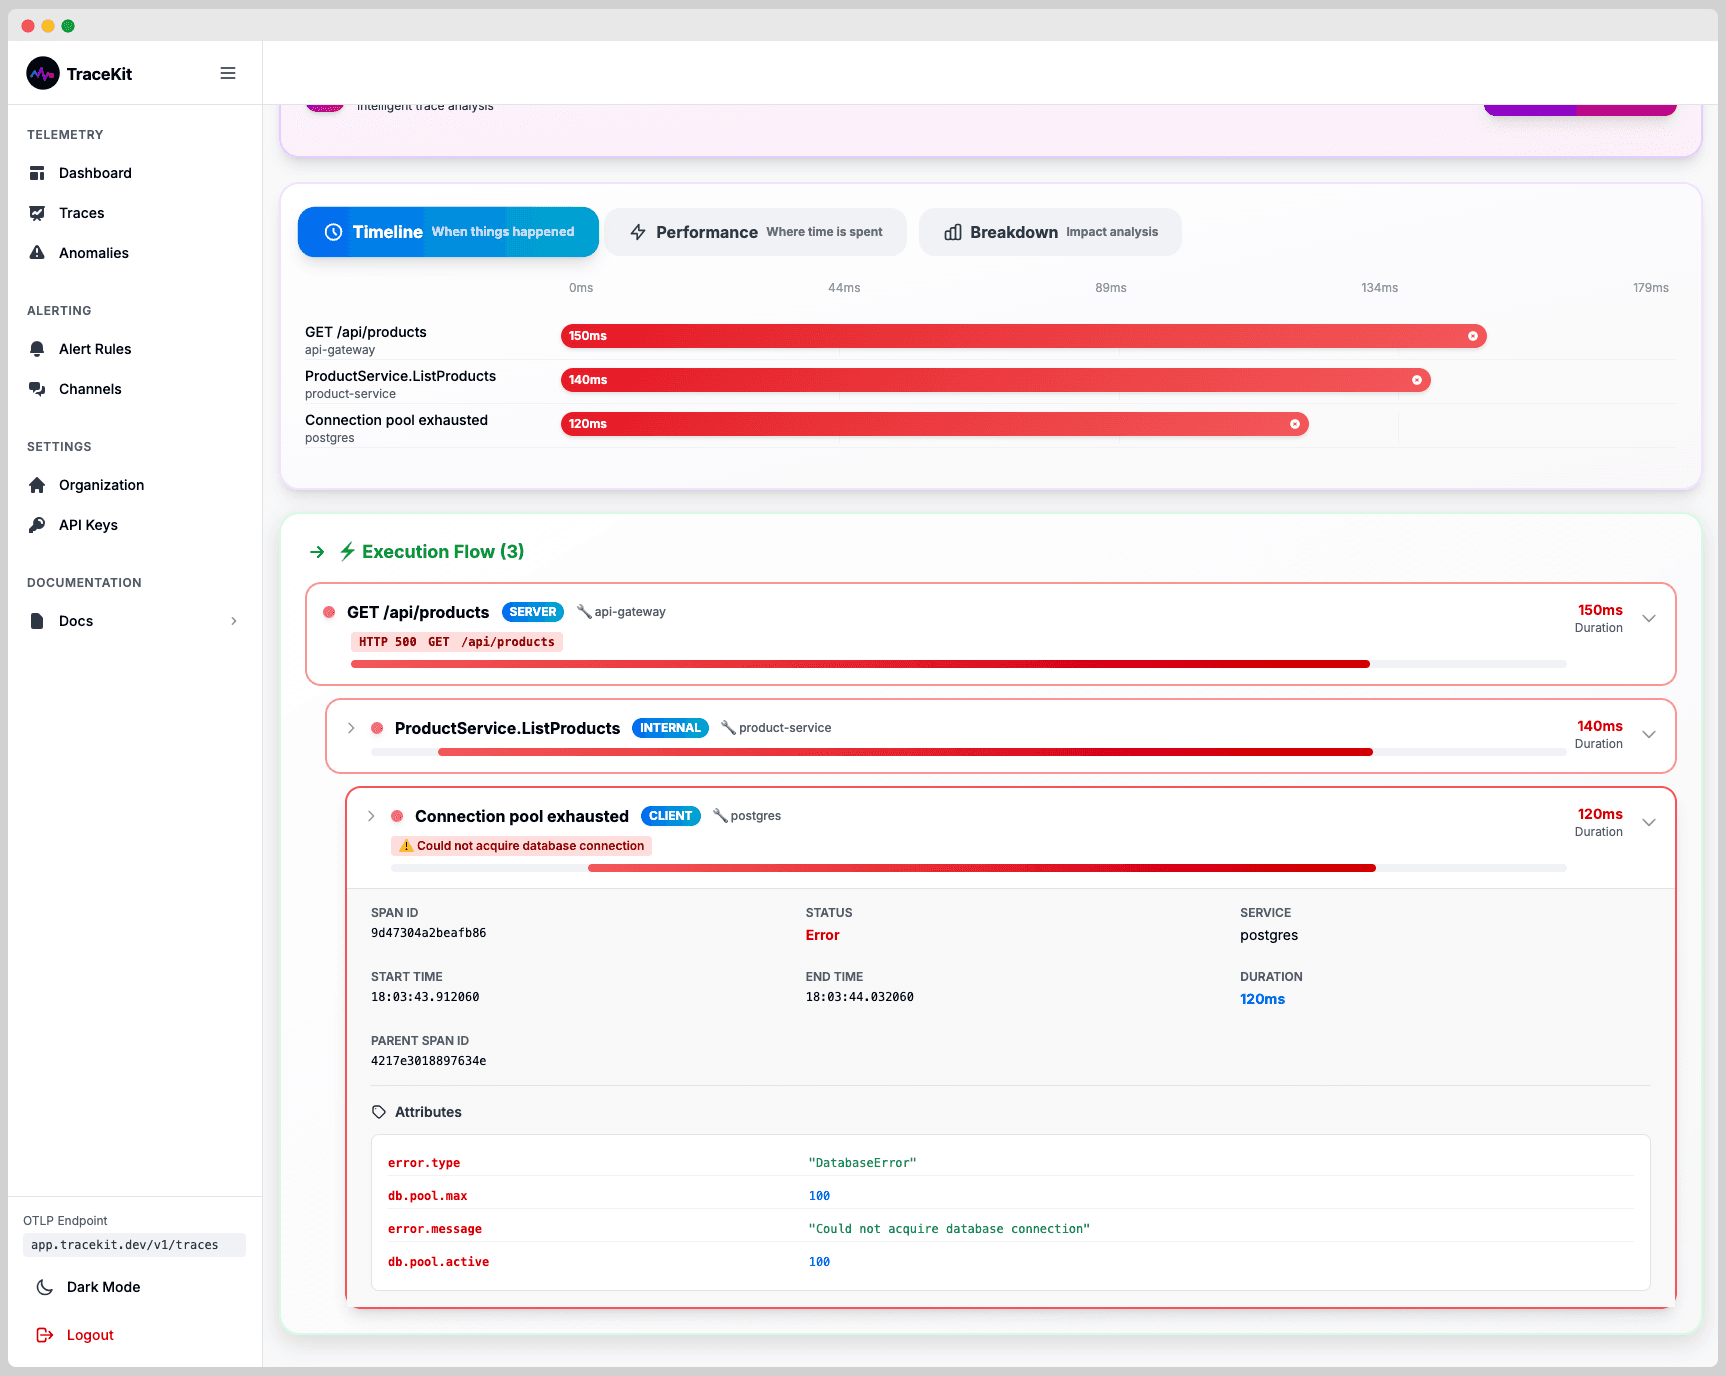
Distributed tracing is a must for modern applications. When a user request touches multiple services - like an API gateway, authentication service, database, and payment processor - distributed tracing maps the entire journey across these systems.
The first step is ensuring that each service propagates trace context. This identifier travels with every request, linking related operations together. Without it, you’d lose the ability to connect the dots between services.
For microservices running on Kubernetes, you’ll need to instrument each service. Deploy the OpenTelemetry collector as a DaemonSet or sidecar container to gather traces from all your pods. The collector simplifies your setup by centralizing trace processing, sampling, and routing, keeping your application code clean.
For serverless environments like AWS Lambda or Google Cloud Functions, instrumentation works a bit differently. Many observability platforms offer Lambda layers or extensions that automatically capture traces. These layers wrap your function handler to track activity without requiring code changes. However, in serverless setups, instrumentation might slightly increase cold start times. To minimize this, opt for lightweight instrumentation and consider keeping critical functions warm.
Even monolithic applications benefit from distributed tracing. You can track a request as it flows through the HTTP handler, business logic, database queries, and external API calls. This visibility helps identify bottlenecks and optimize performance, or even prepare for a future shift to microservices.
Once traces are flowing, focus on visualization. A good trace view uses a waterfall diagram to show all operations in a request, highlighting their durations and any errors. Look for spans that take significantly longer than others - these are your performance bottlenecks. For instance, if a database query is unusually slow, you’ll know exactly where to focus your efforts.
As traffic increases, trace sampling becomes crucial. Capturing every trace can be costly and unnecessary. Start with a high sampling rate during setup, then fine-tune it over time. For critical endpoints or error scenarios, implement intelligent sampling to ensure key traces are always recorded.
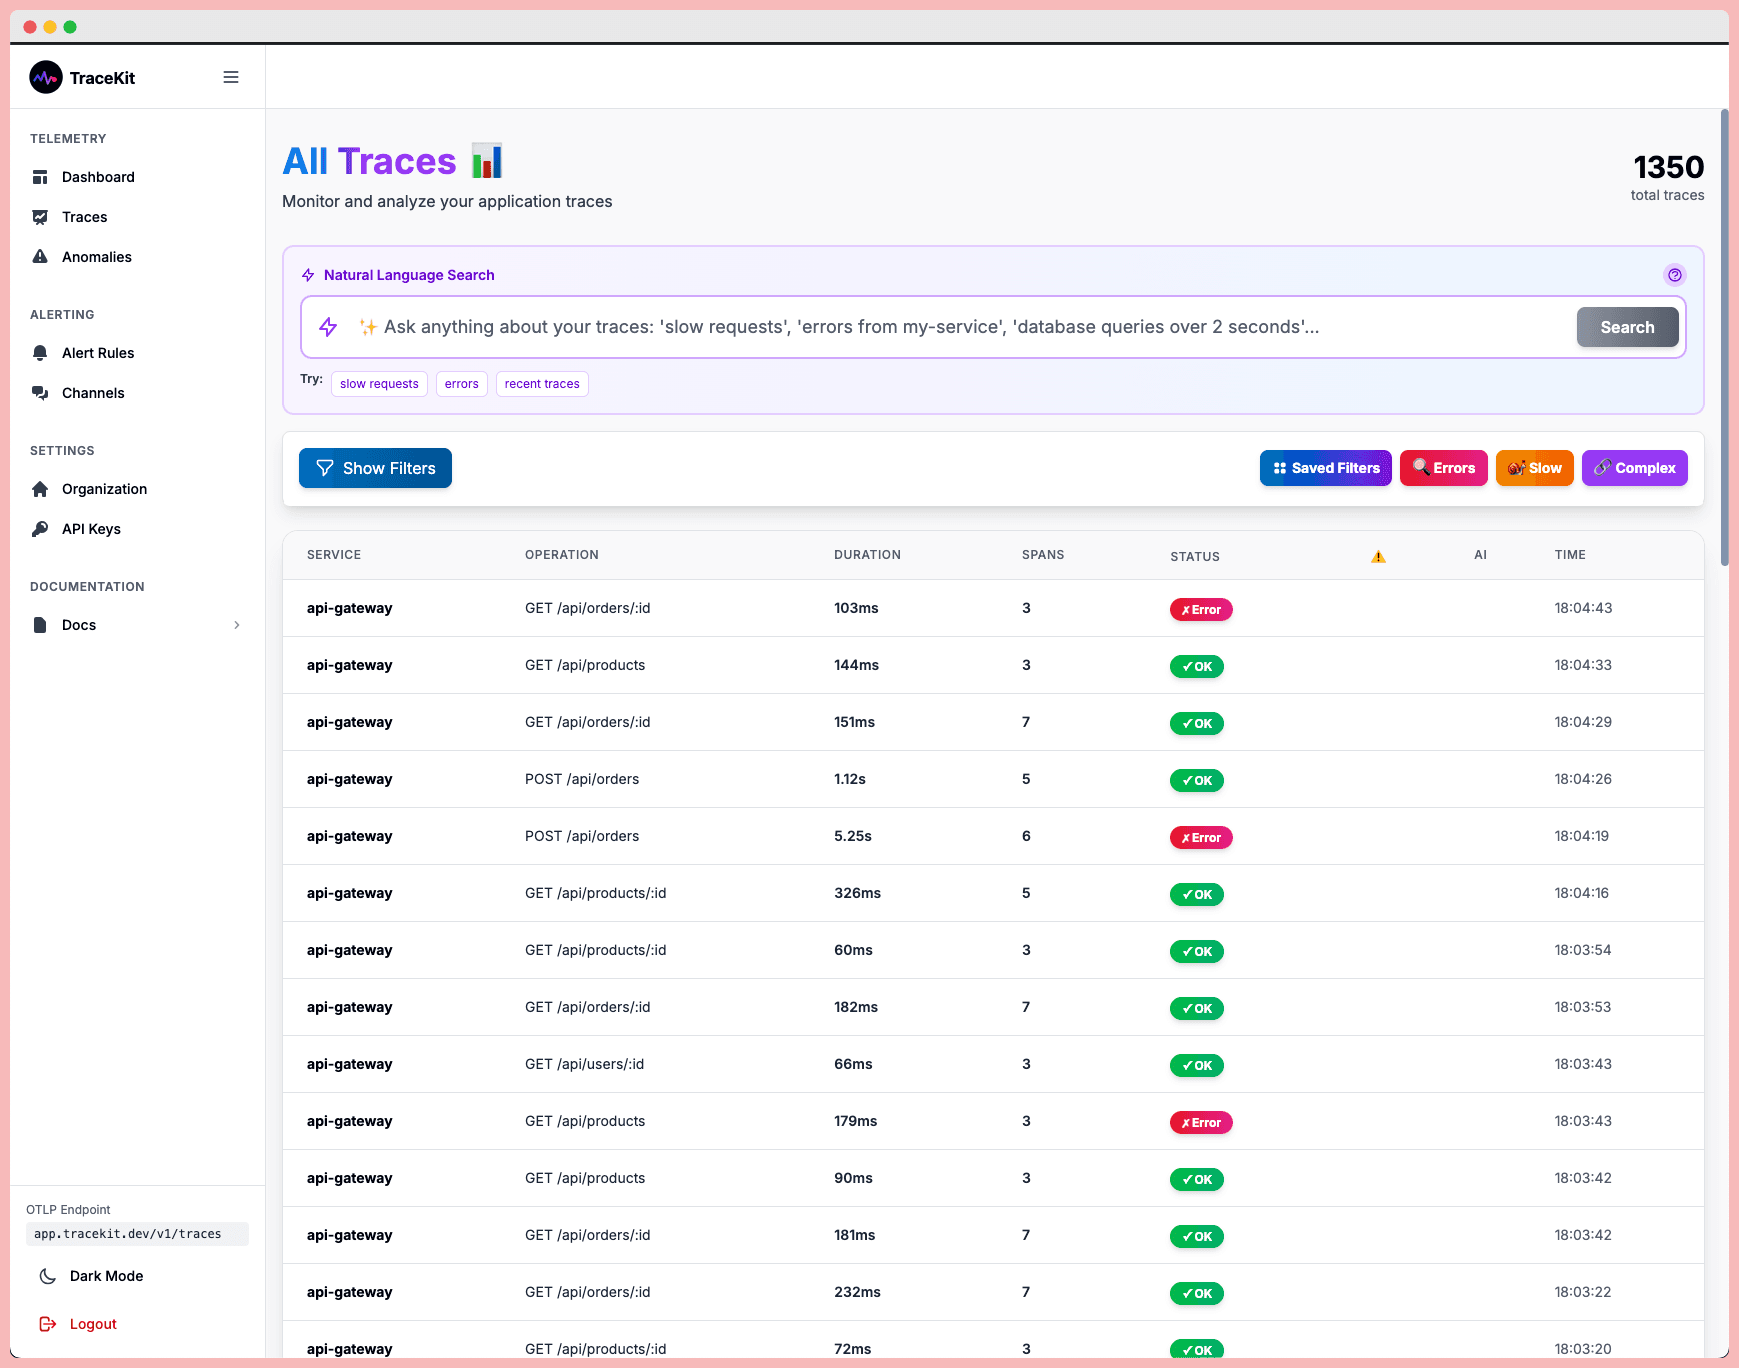
Centralizing Logs and Metrics
With instrumentation and tracing in place, the next step is centralizing your data for better insights. Logs and metrics become far more useful when they’re collected in one place and tied to your traces. This connection turns raw data into actionable information.
Start by centralizing your logs. Instead of digging through individual server logs or Kubernetes pod logs, send everything to a central repository where you can search, filter, and analyze. Use structured logging - storing logs in JSON format with consistent field names - so you can easily query by attributes like user ID, request ID, or error type.
The real magic happens when logs are linked to traces. By including trace and span IDs in your logs, you can quickly jump from a trace to all logs generated during that request. This makes debugging much faster - you won’t have to sift through millions of log entries to find what you need.
Metrics, on the other hand, give you a high-level view of your system. While traces capture individual requests, metrics aggregate data over time. You can track things like requests per second, average response times, error rates, or resource usage. These metrics help you spot trends and trigger alerts when something goes wrong.
Many modern observability platforms can automatically generate metrics from trace data. For example, they might calculate the 95th percentile response time for each endpoint or track error rates by service. This reduces the need for custom instrumentation while still providing the data you need for dashboards and alerts.
If your team has limited time, focus on getting traces and logs up and running first. Traces provide the granular detail you need for debugging, while logs offer essential context. Metrics can often be derived from traces, so you can delay setting up custom metrics until a specific need arises.
Some platforms offer automatic instrumentation tailored to your tech stack. These tools can detect your framework and start capturing traces, logs, and metrics with minimal setup. This quick-start approach is perfect for startups, allowing you to focus on building your product while still gaining valuable insights into your system’s performance.
Using AI-Powered Observability Tools
AI-powered observability tools bring a new level of efficiency to managing complex systems. By automating tasks like pattern recognition, alert prioritization, and root cause analysis, these tools free up your engineering team to focus on building and improving features. For startups with smaller teams, this can be a game-changer.
While human expertise remains essential, AI complements it by delivering actionable insights that help resolve issues faster and even prevent them from occurring. Let’s dive into how AI supports anomaly detection, root cause analysis, and performance optimization.
Automated Anomaly Detection
Static alerts can often lead to unnecessary noise, flooding teams with false alarms. AI-powered systems take a smarter approach by learning what "normal" looks like based on historical data. They adapt to changes in application behavior caused by varying traffic patterns or workloads, flagging only the deviations that truly matter.
This means fewer distractions and more focus on real issues. Some tools even go a step further, correlating related signals to provide a more comprehensive view of potential problems.
AI-Assisted Root Cause Analysis
When production issues strike, engineers don’t have the luxury of time to manually sift through logs or trace errors across multiple microservices. This is where AI steps in. It automatically connects related events, groups similar errors, and highlights recurring patterns that could point to a common cause.
By analyzing distributed traces, the system identifies discrepancies between failed and successful requests, mapping out the failure path. It also pulls relevant log entries to explain what went wrong, offering suggestions based on patterns from past incidents. This approach provides a strong starting point for troubleshooting, dramatically cutting down resolution times.
Performance Optimization with AI
AI tools don’t just help fix problems - they also help you optimize your application’s performance. By analyzing trace data, these tools uncover bottlenecks and inefficiencies that might otherwise go unnoticed but could still impact user experience.
For example, they can pinpoint slow database queries, inefficient API calls, or poorly utilized resources. Instead of wading through complex performance visualizations, your team gets a prioritized list of actionable steps, like optimizing specific queries or reallocating resources to better match usage.
These tools also identify resource waste, flagging services that consistently underuse their allocations or are nearing capacity. Tracking performance trends over time allows you to measure the impact of optimizations and make informed decisions about where to focus engineering efforts.
AI-powered observability tools don’t replace skilled engineers - they amplify their impact. By automating repetitive tasks and providing clear insights, these tools allow your team to spend more time on innovation and less time on troubleshooting.
Choosing and Operating an Observability Platform
Picking the right observability platform can make or break your ability to balance costs with system visibility. The challenge lies in finding a solution that fits your budget, offers robust capabilities, and is simple enough for a small team to handle.
What to Look for in a Platform
Start by considering the pricing structure. Look for platforms with request-based pricing that scales predictably as your usage grows. Avoid pricing models that penalize horizontal scaling or come with hefty storage costs from unfiltered data ingestion. Before committing, calculate potential costs at 2x, 5x, and even 10x your current traffic to avoid surprises down the road.
Ease of setup is another critical factor. If you're a small team, you can't afford to burn weeks configuring agents or troubleshooting integrations. Opt for platforms with zero-configuration setup and automatic instrumentation for popular frameworks. This way, you're up and running in minutes, without pulling developers away from core tasks.
Make sure the platform supports your entire tech stack. Whether you're using PHP, Node.js, Go, Python, Java, or Ruby - or even a mix of these - the platform should handle it all seamlessly. Mixed-language environments are common in startups, and consistent instrumentation across your stack can save you from juggling multiple tools.
Check the integration options. The platform should easily connect with your existing tools, like alerting systems, incident management platforms, and communication channels such as Slack or Microsoft Teams. Support for open standards like OpenTelemetry is a big plus, as it allows flexibility to switch platforms later without overhauling your setup.
Finally, consider data retention policies. For most startups, a 30-day retention period strikes a good balance, offering enough historical data to debug issues and spot trends without incurring unnecessary storage costs. Some platforms even offer tiered retention, storing recent data in fast-access systems while archiving older data more affordably.
With these features in mind, the next step is learning how to manage your platform efficiently without breaking the bank.
Controlling Observability Costs
Startups often face a tough choice: either skimp on monitoring and risk missing critical insights or overspend on tools that eat up a big chunk of the budget. The key is to strike a balance by optimizing how data is handled before it reaches costly storage.
Selective instrumentation is a smart way to save. For example, you can capture 100% of checkout flows and payment processes while sampling only 10% of routine API health checks. This approach ensures you gather detailed data where it matters most without overspending.
Be cautious, though, about cutting too much data. Over-aggressive sampling, indiscriminate log pruning, or reducing data granularity can leave you without the insights you need to troubleshoot issues. The goal is thoughtful filtering, not blind cost-cutting.
Smart retention policies can also help. Keep high-resolution data for recent periods when it's most useful, and archive or aggregate older data. But don’t go so far that you lose the ability to investigate intermittent issues - short retention periods can undermine the entire purpose of observability.
A hybrid approach often works best for startups. Use traditional IT monitoring for predictable systems like databases or caches, while focusing application observability efforts on high-impact areas like user-facing APIs or payment flows. This strategy lets you concentrate your budget where it delivers the most value.
Be mindful of hidden complexities when consolidating tools. While combining logs, metrics, and traces into one platform can sound efficient, some vendors charge separately for each data type or introduce performance bottlenecks. Always evaluate the total cost of ownership, not just the headline pricing.
Once you've managed costs, the next step is weaving observability into your development process for even better results.
Adding Observability to CI/CD Pipelines
After setting up a cost-effective platform, the next step is integrating observability into your development workflow. By making observability a natural part of your CI/CD pipeline, you can catch issues earlier and simplify debugging during deployments.
Automate instrumentation for every new service in your CI/CD pipeline. This ensures telemetry data is captured from day one, eliminating blind spots in your architecture.
Use deployment markers to link performance changes to specific releases. This makes debugging faster and more focused, as you won’t need to sift through unrelated commits to find the root cause.
Incorporate observability into pre-production testing. Capture full traces during load tests in staging environments and compare them to production baselines. If a new feature introduces slow database queries or inefficient API calls, you’ll catch it before users are affected.
Set up automated rollback triggers based on observability metrics. For example, if error rates spike or critical service level objectives (SLOs) fail right after a deployment, your pipeline can automatically revert to the previous version and notify the team. This minimizes the impact of bad deployments on your users.
Finally, connect observability data to pull requests and deployment logs. When engineers review code changes, they should see performance metrics and error rates alongside test results. This feedback loop helps teams make informed decisions and design more reliable systems.
Conclusion
Application observability doesn’t have to break the bank or overwhelm your startup. The trick is to start small and expand your monitoring efforts as your needs grow. Focus on the areas that directly affect your users - like checkout processes, authentication, and payment systems - rather than trying to monitor every single component right away.
The three cornerstones of observability - logs, metrics, and traces - work together to give you a complete picture of your application’s health. You don’t need to aim for perfect coverage on day one. Start by implementing distributed tracing for critical workflows, add specific metrics to track performance, and centralize your logs to provide context when something goes wrong. This step-by-step approach keeps costs in check while delivering real value.
Set clear Service Level Objectives (SLOs) to guide your monitoring efforts. By defining measurable goals like response time targets, you can focus your alerts on what truly matters and avoid being overwhelmed by less important signals.
Thanks to modern AI-powered tools, observability is now more accessible for smaller teams. Features like automated anomaly detection can catch issues that manual monitoring might overlook, and AI-driven root cause analysis can save you hours of troubleshooting. These tools bring enterprise-level capabilities to startups, helping you stay ahead without needing a large operations team.
When choosing an observability platform, prioritize solutions with transparent pricing, easy setup, and support for open standards like OpenTelemetry. To manage costs without losing valuable insights, focus on selective instrumentation and smart data retention policies.
Make observability a natural part of your development process by integrating it into your CI/CD pipeline. Features like deployment markers, automated rollbacks, and pre-production testing can help you catch problems before they affect users. This proactive approach ensures your application remains reliable as you speed up release cycles.
At the end of the day, building dependable applications isn’t about having the most advanced monitoring tools - it’s about having the right visibility into the systems that matter most. Start small, scale as you grow, and invest in understanding your application’s behavior. The effort you put in today will pay off as your startup evolves.
FAQs
What are some cost-effective strategies for startups to implement application observability?
Startups can manage observability costs more effectively by focusing on collecting only the data that truly matters - the kind that aligns directly with their business goals and Service Level Objectives (SLOs). By using smart data retention policies and strategic sampling, teams can zero in on critical insights while avoiding the extra expense of storing and processing unnecessary information.
Another way to trim costs is by right-sizing resources to fit actual needs and leveraging tools that offer AI-driven optimizations to make operations more efficient. For early-stage teams, open-source tools can be a budget-friendly alternative without sacrificing functionality. Encouraging a cost-aware mindset among team members also plays a key role in ensuring observability efforts stay efficient and aligned with the company's growth trajectory.
How can integrating observability into a CI/CD pipeline benefit a startup?
Integrating observability into your CI/CD pipeline gives startups a clear view of how new code behaves in real-time once it’s deployed. This means teams can spot issues quickly, pinpoint their causes, and fine-tune performance before users are affected.
For startups, where moving fast and staying flexible are key, observability helps ensure smoother deployments. It minimizes downtime, boosts system reliability, and allows for quicker problem-solving. Plus, it drives ongoing improvement by offering insights into how code changes influence system performance.
How can AI-powered observability tools help small teams quickly detect and resolve issues?
AI-powered observability tools are a game-changer for small teams, automating vital tasks like root cause analysis, real-time monitoring, and anomaly detection. By processing massive datasets, these tools uncover patterns, detect irregularities, and offer actionable insights that help teams tackle issues more efficiently and accurately.
For resource-strapped teams, these solutions minimize the need for manual troubleshooting, freeing up developers to concentrate on enhancing system performance and refining user experience. With proactive alerts and smart diagnostics, AI-driven tools streamline problem-solving and help ensure systems run smoothly.
Related Blog Posts
Related Posts
Your API Just Threw a 500. Here's How to Actually Fix It.
Your API threw a 500 at 3 AM. A systematic approach to diagnose, trace, and fix production API errors without the panic and guesswork.
OpenTelemetry Implementation Guide: Step-by-Step Setup (2026)
Complete OpenTelemetry setup guide. Install the SDK, configure exporters, and ship your first traces in under 5 minutes. Covers Node.js, Python, Go, and Java.
Observability Definition: Complete Guide for 2026
What is observability? Complete guide covering the three pillars (metrics, logs, traces), implementation strategies, and tools for modern software systems.