Best Practices for Real-Time Metrics in Microservices
Set up real-time metrics for microservices: key metrics to track, tools like Prometheus and OpenTelemetry, alerting best practices, and scaling tips.

Real-time metrics are the backbone of managing microservices effectively. Without them, identifying and resolving issues becomes guesswork, leading to outages that can cost businesses up to $500,000 per hour. Here's how to set up real-time monitoring for your system:
- Track Key Metrics: Focus on system-level stats (CPU, memory, network) and service-specific data (API success rates, latency, errors).
- Use Proper Tools: Combine pull-based tools like Prometheus with push-based options like StatsD for flexibility.
- Distributed Tracing: Pinpoint bottlenecks across services using tools like OpenTelemetry and Jaeger.
- Set Up Alerts: Define thresholds for latency, error rates, and other user-impacting issues. Avoid alert fatigue with actionable notifications.
- Optimize for Scale: Limit high-cardinality labels, automate responses, and balance granularity with performance.
Real-time dashboards and anomaly detection ensure you catch problems before users do. By aligning monitoring with Service-Level Objectives (SLOs), you can maintain system health without overloading resources. Start small, prioritize critical metrics, and scale as needed.
Performance Metrics Microservice Design Pattern Tutorial with Example for Programmers
Identify Critical Metrics to Monitor
The foundation of effective real-time monitoring lies in selecting the right metrics. Proven frameworks like RED, USE, and the Four Golden Signals help focus on key performance indicators essential for maintaining system health and performance.
Core System Metrics
Start by monitoring infrastructure-level metrics. These include CPU utilization, memory usage, disk I/O, and network bandwidth - all of which confirm resource availability. Importantly, these metrics should be tracked inside containers, not just at the container level. Containers may appear healthy even when internal processes are underperforming.
Baseline performance metrics are essential. Use load testing to establish these baselines and set thresholds that signal actual performance issues. However, with systems generating hundreds of metrics, manually setting thresholds can be overwhelming. This is where machine learning-powered anomaly detection comes in, automatically identifying performance thresholds.
Beyond general system metrics, it’s crucial to tailor monitoring to the specific functions of individual services.
Service-Specific Metrics
Each microservice has unique needs, so metrics should align with its specific functions. For example, tracking API success rates, database query performance, cache hit ratios, and internal exceptions (both handled and unhandled) provides a clear picture of service health. Google’s Site Reliability Engineering (SRE) team highlights the importance of focusing on these four metrics for user-facing systems:
"If you can only measure four metrics of your user-facing system, focus on these four: Latency, Traffic, Errors, and Saturation".
Additionally, language-specific metrics can offer valuable insights. For instance, Python services benefit from monitoring uwsgi worker counts, while Java applications require tracking thread pool utilization. For caches, keeping an eye on hit/miss ratios and latency is key, while for thread pools, metrics like queued requests and task duration help pinpoint bottlenecks. The instrumentation overhead for collecting such data is minimal - for example, incrementing a Java counter takes only 12–17 nanoseconds.
Finally, it’s essential to monitor how services communicate with each other.
Inter-Service Communication Metrics
Microservices are interconnected, and their communication health is just as important as their individual performance. Metrics like request queue lengths, service call latency, and dependency health reveal how services interact and where communication issues may arise. Monitoring both client and server sides helps distinguish between network latency and service degradation.
In distributed systems, even small performance issues can escalate. For example, the 99th percentile latency of a single backend service can dominate the frontend's median response time. A web service averaging 100 ms latency could have 1% of requests taking up to 5 seconds.
Using unique request IDs to trace requests across services makes it easier to identify problems spanning multiple services and log files. However, avoid using high-cardinality labels, such as User IDs, as they can create an overwhelming number of time-series data points.
Set Up Monitoring and Visualization
Once you've identified the key metrics to track, the next step is setting up the infrastructure to collect and display them effectively. This ensures you gain real-time insights into your system's performance. Start by choosing the right tools for data collection.
Deploy Metrics Collection Tools
Decide between pull-based and push-based collection methods for gathering metrics. Pull-based systems, like Prometheus, connect directly to service endpoints to scrape data. This has the added benefit of acting as a health check - if the scrape fails, it's a clear indicator that the service might be down. On the other hand, push-based systems, such as Azure Monitor or StatsD, require services to send metrics to a designated target. Push-based setups are often simpler to configure since each component only needs to know its destination.
To make debugging easier and keep instrumentation close to the core logic, embed metric collection directly into your code. As noted in Prometheus documentation:
Instrumentation should be an integral part of your code. Instantiate the metric classes in the same file you use them.
Additionally, deploy agents like Telegraf, Prometheus, or StatsD on your hosts, virtual machines, or Kubernetes clusters to forward telemetry data.
It's also important to filter data at the source to avoid overwhelming your central monitoring system with unnecessary noise. Centralize logs, metrics, and traces from all stages of your software delivery pipeline in one location for complete visibility.
Use Standard Naming Conventions
To ensure clarity and compatibility across services, adopt consistent naming conventions for your metrics. Stick to base units like seconds for time and bytes for storage, avoiding smaller or larger units like milliseconds or megabytes. This consistency makes it easier to combine metrics from various sources. Include a service-specific prefix in metric names, such as payment_service_request_duration_seconds, to make their origin immediately identifiable.
Metric names should also include both the unit and type. For example, use names like http_request_duration_seconds or memory_usage_bytes for clarity. For counters that accumulate over time, append _total to the name to differentiate them from gauges. Avoid embedding dynamic values, like user IDs or error messages, directly in metric names. Instead, use labels to keep names static and easier to search.
Be mindful of label cardinality. Ideally, keep the number of unique key-value pairs (cardinality) below 10 for most metrics. Each unique combination creates a new time series, which can consume significant RAM and CPU resources. High-cardinality labels can severely impact the performance of your monitoring system.
Build Real-Time Dashboards
With metrics collected and named consistently, you can now design dashboards that provide a clear view of your system's health. Focus on the Four Golden Signals: latency, traffic, errors, and saturation. These metrics offer the most direct insight into the system's performance and user experience. Avoid relying solely on default dashboards; instead, customize them to align with the specific needs of your application.
Use histograms to visualize request counts grouped by latency buckets, especially at the 99th percentile. This approach helps identify performance issues affecting a subset of users that averages might obscure. Design alerts that encourage thoughtful responses rather than triggering automated actions.
Tailor dashboards to suit different audiences. For instance, IT teams may need detailed root cause analysis and trend data, while senior managers might focus on metrics that show business impact. Remove unused signals from dashboards and alerts to reduce maintenance complexity and system fragility. Finally, combine white-box monitoring (internal metrics and logs) with black-box monitoring (external behavior) to detect both potential issues and user-facing problems.
Implement Distributed Tracing
Metrics help you understand what's happening (like high latency), and logs shed light on why (such as connection timeouts). But distributed tracing answers the crucial question: where are the bottlenecks in your microservices? While logs provide context for failures, traces guide you to the exact service that needs attention. When paired with real-time metrics, distributed tracing becomes a vital part of your observability toolkit by showing precisely where slowdowns occur. Each trace is assigned a unique Trace ID to track a request as it moves across services.
Instrument Services for Tracing
Start by using OpenTelemetry as your go-to instrumentation standard. Choose a backend for storing and visualizing your traces, such as Jaeger, Zipkin, or AWS X-Ray. For basic needs, zero-code instrumentation can automatically capture HTTP requests and database queries. But for tracking specific business operations - like "calculate-shipping-cost" - you’ll want to use manual instrumentation.
One of the most important steps is setting up context propagation. This ensures that Trace IDs and Span IDs are passed between services, often through HTTP headers (like traceparent) or message queue metadata. Configure your SDK to send trace data via the OpenTelemetry Protocol (OTLP) to a central Collector, which aggregates and forwards the data to your chosen backend. Once your services are instrumented, the next step is to map out their interactions.
Visualize Service Dependencies
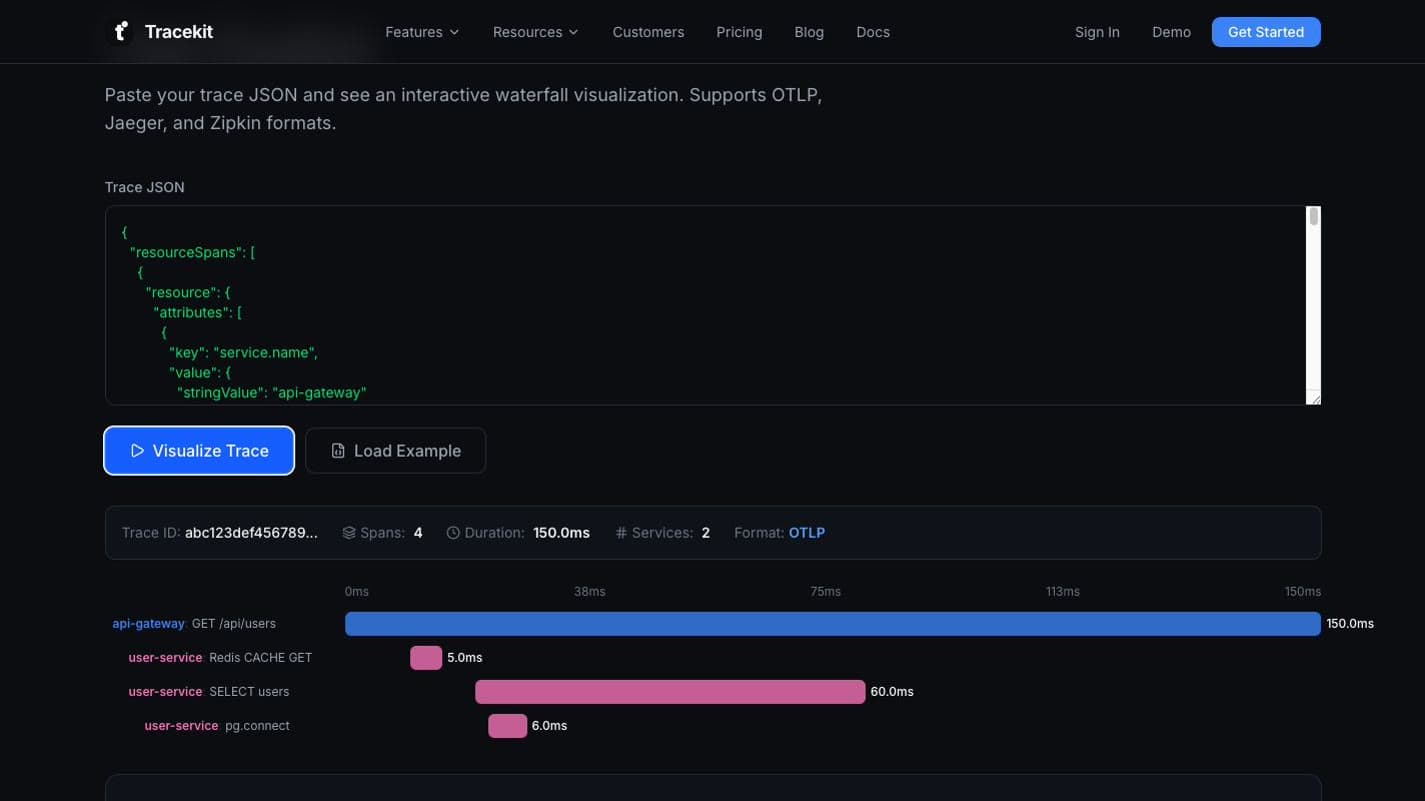
With instrumentation in place, you can now visualize how your services interact. Most tracing backends automatically create service dependency maps, which show how microservices are connected and reveal potential cascading failures. These maps highlight inter-service dependencies and help pinpoint weak spots, like single points of failure. Another useful tool is the waterfall diagram, which breaks down the parent–child relationships between spans. This makes it easy to see which operations are sequential and which are parallel.
For instance, Netflix uses Zipkin to visualize the flow of requests and integrates tracing data with metrics to optimize performance. By analyzing these visualizations, you can identify the critical path - the longest chain of dependent spans that determines overall response time. In 2024, Java Microservices Architect Daniel Swift used trace analysis to uncover a major bottleneck in an e-commerce platform. Synchronous product recommendation calls were delaying the checkout process, but switching to asynchronous operations reduced checkout latency by 40%.
Identify and Fix Latency Spikes
When tackling performance issues, focus on the top 20% of operations that generate 80% of your traffic. Enhance your logs with Trace IDs and include span attributes like http.status_code, db.statement, or user.id to make filtering and troubleshooting more efficient.
To manage storage costs while maintaining visibility, sample strategically. Capture 100% of error responses (such as 4xx/5xx status codes) and requests that exceed your SLA thresholds, while sampling only 5–10% of normal traffic. This ensures you never miss critical failures while keeping data manageable. As the OpenTelemetry documentation puts it:
An application is properly instrumented when developers don't need to add more instrumentation to troubleshoot an issue, because they have all of the information they need.
Deploy an OpenTelemetry Collector to batch and compress trace data, reducing overhead before sending it to your backend.
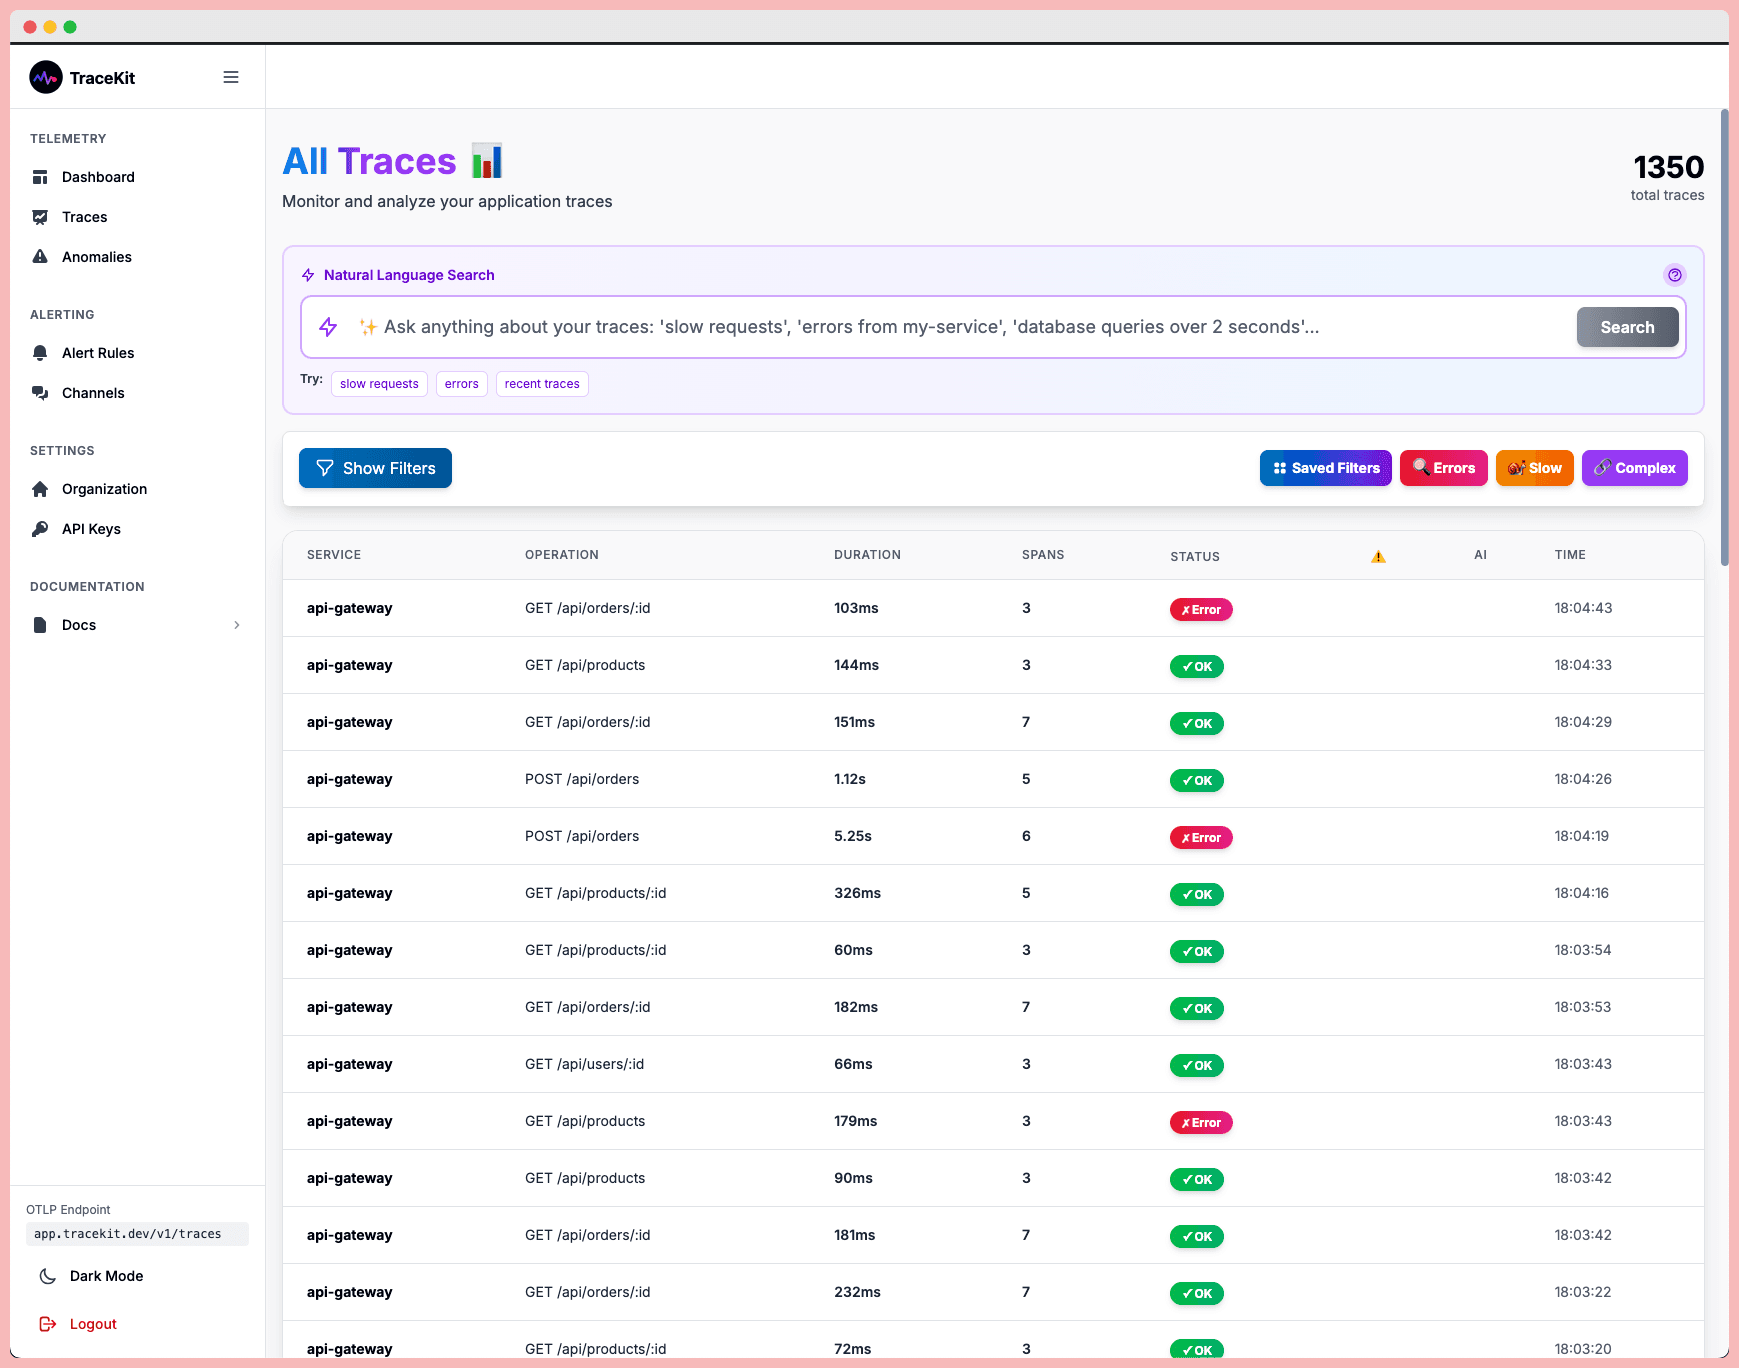
For additional help, tools like TraceKit can be a game-changer. TraceKit provides dynamic logs in production and automated instrumentation, allowing teams to capture variable state and debug issues without redeploying.
Configure Alerts and Anomaly Detection
Alert Severity Levels and Response Guidelines for Microservices Monitoring
Setting up alerts is essential to catch potential issues early, before they spiral into major problems. The aim is to notify your team about problems impacting user experience while avoiding unnecessary noise. Building on your monitoring and tracing setup, well-configured alerts enable proactive action. Once alerts are in place, the next step is defining clear and meaningful thresholds.
Define Alert Thresholds
Focus your alerts on user-facing symptoms like high latency or elevated error rates, rather than underlying technical causes. For instance, if a backend component slows down but the overall user experience remains stable, there’s no need to trigger an alert.
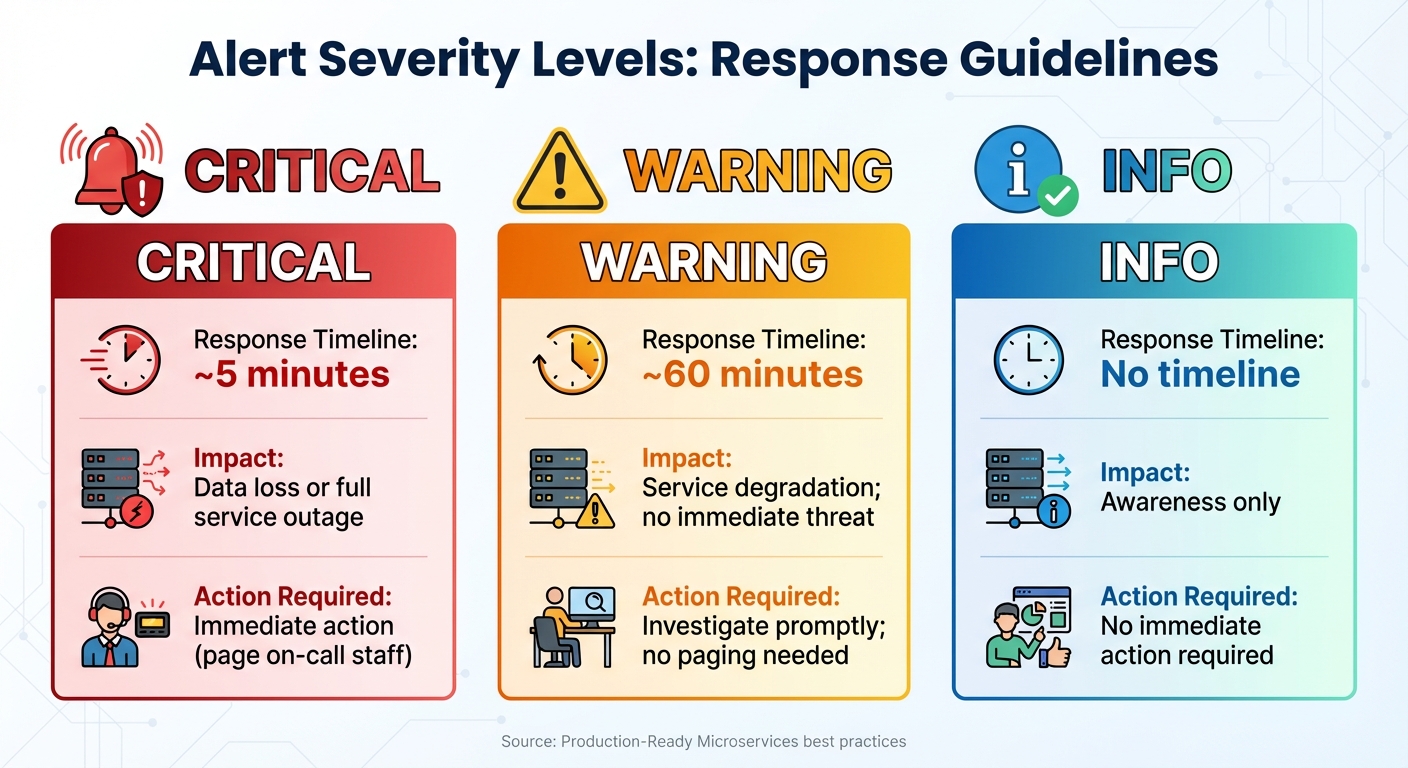
Establish three levels of severity: Normal (everything is healthy), Warning (minor deviations requiring attention within about 60 minutes), and Critical (serious issues needing immediate action within 5 minutes). As Susan Fowler, author of Production-Ready Microservices, explains:
"In an ideal world, warning thresholds should trigger alerts that lead to quick detection, mitigation, and resolution before any critical thresholds are reached".
Use load testing to determine baseline performance and to set thresholds for warning and critical levels. For online systems, monitor latency and error rates. For offline processes, track data processing times. For batch jobs, set alerts if a job fails to complete within a window that allows at least two full runs.
| Alert Severity | Response Timeline | Impact | Action Required |
|---|---|---|---|
| Critical | ~5 minutes | Data loss or full service outage | Immediate action (page on-call staff) |
| Warning | ~60 minutes | Service degradation; no immediate threat | Investigate promptly; no paging needed |
| Info | No timeline | Awareness only | No immediate action required |
Prevent Alert Fatigue
After defining thresholds, it’s crucial to ensure alerts remain actionable and don’t overwhelm your team. Every alert should serve a purpose. If an alert isn’t relevant or doesn’t help the on-call engineer resolve an issue, it should either be adjusted or removed.
Keep alerts simple, actionable, and focused on symptoms. Each alert should include a link to a runbook for quick troubleshooting. Use duration windows to avoid triggering alerts for temporary spikes. For example, in Prometheus, a for: 15m clause ensures that an alert only fires if a condition persists for 15 minutes.
Automate repetitive mitigation steps. If an issue is often resolved with the same actions, consider automating the fix. Also, prioritize alerts at the highest point in the stack to avoid redundant notifications. If a low-level failure doesn’t affect user-facing services, there’s no need to notify the on-call staff. Keep in mind that bad deployments and insufficient monitoring are among the leading causes of outages in microservice environments.
Enable Real-Time Anomaly Detection
In systems with hundreds of metrics, manually setting thresholds for every scenario becomes impractical. Machine learning can step in here, automatically identifying thresholds and flagging anomalies. This approach complements tiered alerts by catching deviations that might otherwise go unnoticed.
When monitoring latency, rely on percentiles rather than averages. Percentiles like the 95th or 99th can highlight tail latency issues affecting a small percentage of users. For example, while the average latency of a web service might be 100 ms, the slowest 1% of requests could take 5 seconds or more - something averages would obscure.
Set alerts for both high values and missing metrics, as the absence of data often indicates silent failures. Tools like TraceKit can automate anomaly detection and use AI-powered alerts to correlate anomalies with trace data, helping you find root causes faster.
Combine business KPIs with operational metrics to detect issues with direct business impact. For instance, link transactions per hour with CPU usage to identify when technical problems might hurt revenue. Use historical data or stress testing to define healthy baselines before configuring anomaly detection thresholds. Lastly, implement metamonitoring - alerts on your monitoring systems themselves - to ensure your infrastructure remains reliable.
Optimize Monitoring Efficiency and Align with SLOs
Once you've set up effective alerts and anomaly detection, the next step is to ensure your monitoring system operates efficiently as your microservices scale. Real-time metrics collection, while vital, comes at a cost - CPU usage, memory, network bandwidth, and storage. The challenge lies in striking the right balance between maintaining visibility and minimizing resource overhead, all while ensuring your monitoring aligns with what truly matters to your users.
Balance Granularity and Performance
One of the biggest contributors to resource consumption in monitoring systems is high cardinality. Adding labels to metrics, like user IDs or session tokens, can quickly multiply the number of time series generated. For instance, in a 10,000-node system, a metric like node_filesystem_avail might create 100,000 manageable time series. But introducing a high-cardinality label like "user_id" could balloon this into millions, potentially overwhelming your system.
To keep things manageable:
- Limit label cardinality. Avoid unnecessary labels, especially in metrics collected at scale.
- Cache label lookups in performance-critical paths that run over 100,000 times per second. This reduces CPU strain in tight loops.
- Internally sample and aggregate data. For example, sample metrics every second on your servers and export aggregated distributions every minute. This approach preserves high-resolution insights without overloading storage.
Use metrics for real-time dashboards and alerts, while reserving logs for detailed root cause analysis, as logs are more resource-intensive. Regularly review and remove telemetry data that isn't tied to any active dashboard or alert to cut down on unnecessary load.
Define and Track SLOs
Service-Level Objectives (SLOs) should reflect what users genuinely care about, rather than what's easiest to measure. Start by identifying your business goals - like ensuring smooth user experiences - and then determine the specific Service-Level Indicators (SLIs) that track those goals. As Chris Jones, a Site Reliability Engineer at Google, explains:
It's impossible to manage a service correctly, let alone well, without understanding which behaviors really matter for that service and how to measure and evaluate those behaviors.
Focus on a few key SLIs, such as latency, error rate, and throughput for user-facing systems, or durability and availability for storage systems. Use high-order percentiles like the 99th or 99.9th to capture worst-case scenarios, while the median (50th percentile) reflects typical performance. For example, a request might typically complete in 50 milliseconds, but the 95th percentile might reveal delays of up to 1,000 milliseconds - details that averages would miss.
Instead of striving for 100% availability, which is both impractical and costly, define an error budget to allow for an acceptable level of failure. This approach balances reliability with innovation. For example, Google Compute Engine sets an availability target of 99.95%, or "three and a half nines".
Start with a flexible SLO target and refine it as you better understand your system's behavior. Keep SLIs simple, as overly complex metrics can obscure performance trends. Use tighter internal SLOs than those shared externally to provide a buffer for addressing issues before they affect users.
Use Automation to Scale Monitoring
Automation is essential for maintaining monitoring efficiency as your system grows. Use Infrastructure as Code (IaC) or automation frameworks to deploy and configure monitoring agents across virtual machines and Kubernetes clusters. Opt for pull-based monitoring systems with auto-discovery capabilities to automatically track new service instances as they scale, reducing the need for manual configuration.
Automate responses to alerts whenever possible. If an alert can be resolved with a script or predefined steps, integrate that response into the system. Rob Ewaschuk, an SRE at Google, emphasizes:
If a page merely merits a robotic response, it shouldn't be a page.
For example, Gmail uses automated scheduler adjustments to reduce alert noise and minimize user impact.
Prometheus recording rules can also help by pre-computing frequently used or resource-intensive expressions, saving them as new time series to improve query performance at scale. Focus on alerts tied to burn rates and error budgets, as these directly impact SLOs. Avoid alerting on minor anomalies that don't affect users. And any recurring issue that can be resolved with a script should be automated - no microservice should require the same manual fix twice.
Tools like TraceKit can further streamline automation by using AI-powered observability to detect anomalies and trace requests across distributed systems. This reduces the manual effort needed to maintain visibility as your microservices environment expands.
Next Steps
To put these best practices into action, start integrating real-time metrics gradually into your system. Focus first on instrumenting your core service frameworks, like RPC and web frameworks. This approach gives you a broad overview quickly, allowing you to identify key areas that need fine-tuning for critical business operations.
Once your core frameworks are set, organize your services by application type and implement vendor-neutral tools like OpenTelemetry. This ensures flexibility and prevents you from being tied to a specific platform. For example, online-serving systems should track metrics like latency, error rates, and throughput. Offline-processing systems benefit from progress tracking and heartbeat timestamps, while batch jobs require metrics like last-success status and runtime.
To speed up the process, use auto-instrumentation for general coverage. Then, focus manual instrumentation on the 20% of your code that supports your most critical operations.
FAQs
What’s the difference between pull-based and push-based metrics collection, and how do I decide which to use?
The decision between pull-based and push-based metrics collection largely hinges on your system's architecture and operational requirements. Each approach comes with its own set of strengths and challenges.
In a push-based model, services take the initiative by sending their metrics to a designated endpoint. This method is straightforward to set up, relies only on outbound network traffic, and gives each service control over how often metrics are sent. However, managing traffic at scale can become tricky, especially in dynamic environments where instances frequently change, making it harder to ensure consistent reporting.
On the other hand, a pull-based model, often associated with tools like Prometheus, works by having a central collector retrieve metrics from services via an HTTP endpoint. This setup provides centralized control, making it easier to decide what gets measured and when. It also includes built-in health checks, adding an extra layer of reliability. That said, this method requires the collector to access all service instances, which can be complicated in environments with firewalls or rapidly changing infrastructure.
When choosing between the two, think about your specific needs. If your system is relatively stable and static, a pull-based approach might simplify management and improve visibility. However, for dynamic and highly elastic setups - or when minimizing inbound connections is a priority - a push-based model might be the better fit. Many teams find value in a hybrid strategy, blending both methods to strike a balance between flexibility and control. Tools like TraceKit can complement either approach, offering dynamic logs and detailed insights to address anomalies effectively.
What are the Four Golden Signals for monitoring microservices?
The Four Golden Signals - latency, traffic, errors, and saturation - are key metrics that offer a clear picture of your system’s health and performance. They’re like a dashboard for spotting issues as they happen.
- Latency: This measures how long it takes to process a request, helping you spot delays that could frustrate users.
- Traffic: Tracks the number of requests your system is handling, giving insight into demand and workload.
- Errors: Keeps an eye on the rate of failed requests or unexpected behaviors, helping you catch problems early.
- Saturation: Reflects how much of your system’s resources - like CPU or memory - are being used, signaling when you’re nearing capacity.
Paying close attention to these signals allows teams to monitor performance, identify bottlenecks, and keep distributed systems running smoothly.
Why should you limit the number of unique labels in your metrics?
Keeping the number of unique labels in your metrics under control is crucial. Why? Because every unique label combination creates its own time series. When the number of these combinations - referred to as high cardinality - gets out of hand, it can cause a spike in storage needs, drag down query performance, and drive up costs.
To keep your monitoring system running smoothly and efficiently, stick to using only the most relevant labels. This approach helps reduce overhead, making your setup more scalable and budget-friendly.
Related Blog Posts
Related Posts

Real-Time Performance Monitoring for Python Applications
Monitor Python apps in real time with OpenTelemetry and TraceKit. Track latency, error rates, and resource usage with auto-instrumentation and tracing.
Observability Definition: Complete Guide for 2026
What is observability? Complete guide covering the three pillars (metrics, logs, traces), implementation strategies, and tools for modern software systems.
OTel Trace Viewer Guide: How to Inspect OpenTelemetry Traces Faster
Compare OTel trace viewer options, learn how to read OpenTelemetry traces, and inspect OTLP, Jaeger, or Zipkin payloads faster.