Best Anomaly Detection Tools for Small Dev Teams (2026)
Compare 6 anomaly detection tools built for small teams. Real-time alerting, easy setup, and affordable pricing. Find the right fit for your stack.

Small development teams often struggle to monitor data effectively due to limited resources. Anomaly detection tools can help by automatically identifying unusual patterns in real-time, reducing manual effort and preventing issues from escalating. This article highlights six tools tailored for small teams, focusing on ease of use, affordability, and integration capabilities:
- TraceKit: Statistical Anomaly Detection for Distributed Tracing.
- Datadog Anomaly Detection: AI-driven tool for metrics, logs, and traces; minimal setup but requires training time.
- New Relic Lookout: Machine learning-powered anomaly detection; integrates seamlessly with New Relic One.
- Anodot: Autonomous SaaS platform; no manual configuration and supports diverse integrations.
- Splunk MLTK: Focused on security and raw data analysis; works well if you're already using Splunk.
- Azure AI Anomaly Detector: Time-series analysis with automatic algorithm selection; retiring in October 2026.
Each tool has strengths suited for specific needs. For quick setup and low costs, TraceKit and Anodot are strong choices. Datadog and New Relic offer robust features for teams with existing infrastructure. Splunk is ideal for security-heavy use cases, while Azure AI Anomaly Detector works well for short-term projects. Choose based on your team's goals, budget, and tech stack.
Anomaly Detection Tools Comparison for Small Development Teams
Best Data Observability Tools for Beginners: Side-by-Side Review
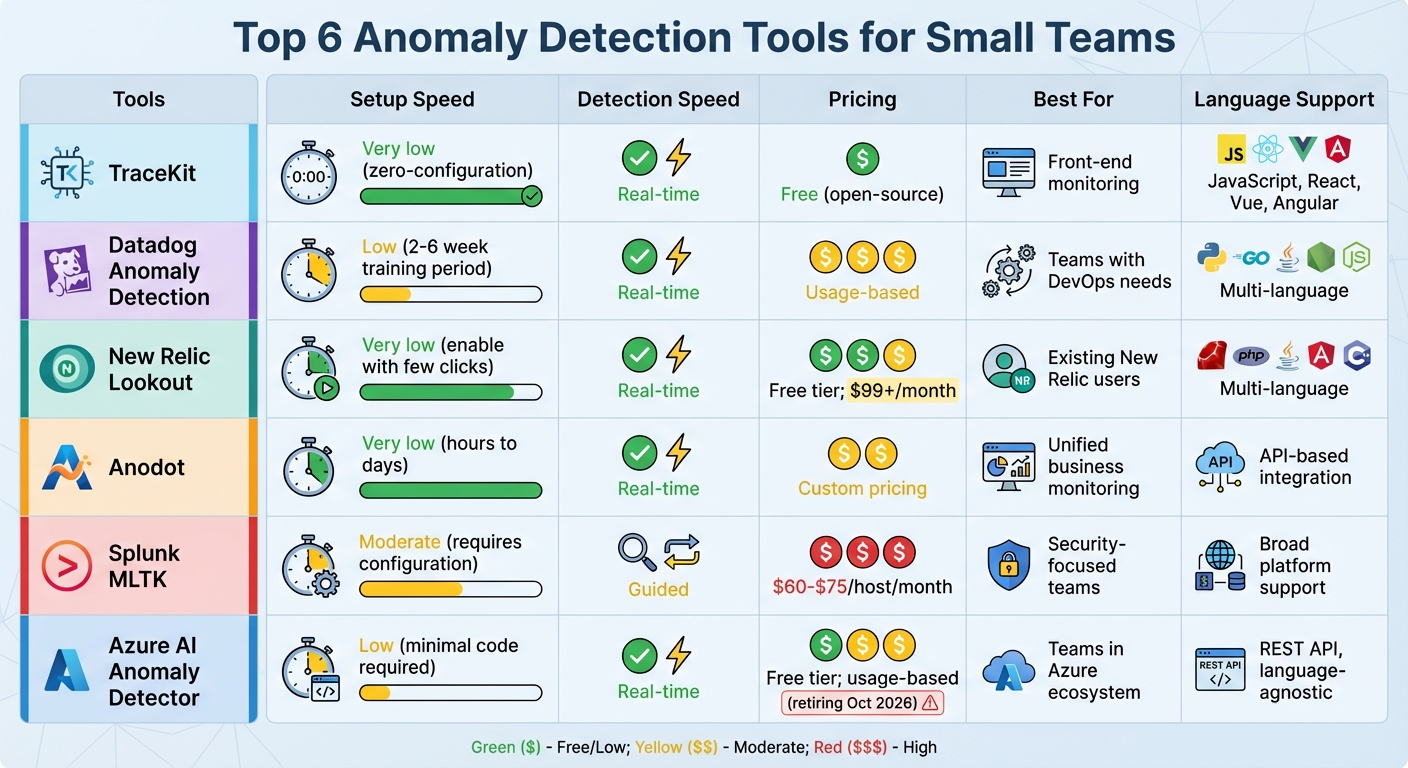
Quick Comparison
| Tool | Setup Speed | Detection Speed | Pricing Structure | Language/Framework Support | Best For |
|---|---|---|---|---|---|
| TraceKit | Very low | Real-time | Free for small teams | PHP, Go, Python, Node.js, Java, Ruby | Full-stack monitoring |
| Datadog Anomaly Detection | Low | Real-time | Usage-based | Multi-language support | Teams with DevOps needs |
| New Relic Lookout | Very low | Real-time | Free tier; $99+/month | Multi-language support | Existing New Relic users |
| Anodot | Very low | Real-time | Custom pricing | API-based integration | Unified business monitoring |
| Splunk MLTK | Moderate | Guided | $60-$75/host/month | Broad platform support | Security-focused teams |
| Azure AI Anomaly Detector | Low | Real-time | Free tier; usage-based | REST API, language-agnostic | Teams in the Azure ecosystem |
These tools simplify anomaly detection, helping small teams save time and resources while maintaining system health.
1. TraceKit
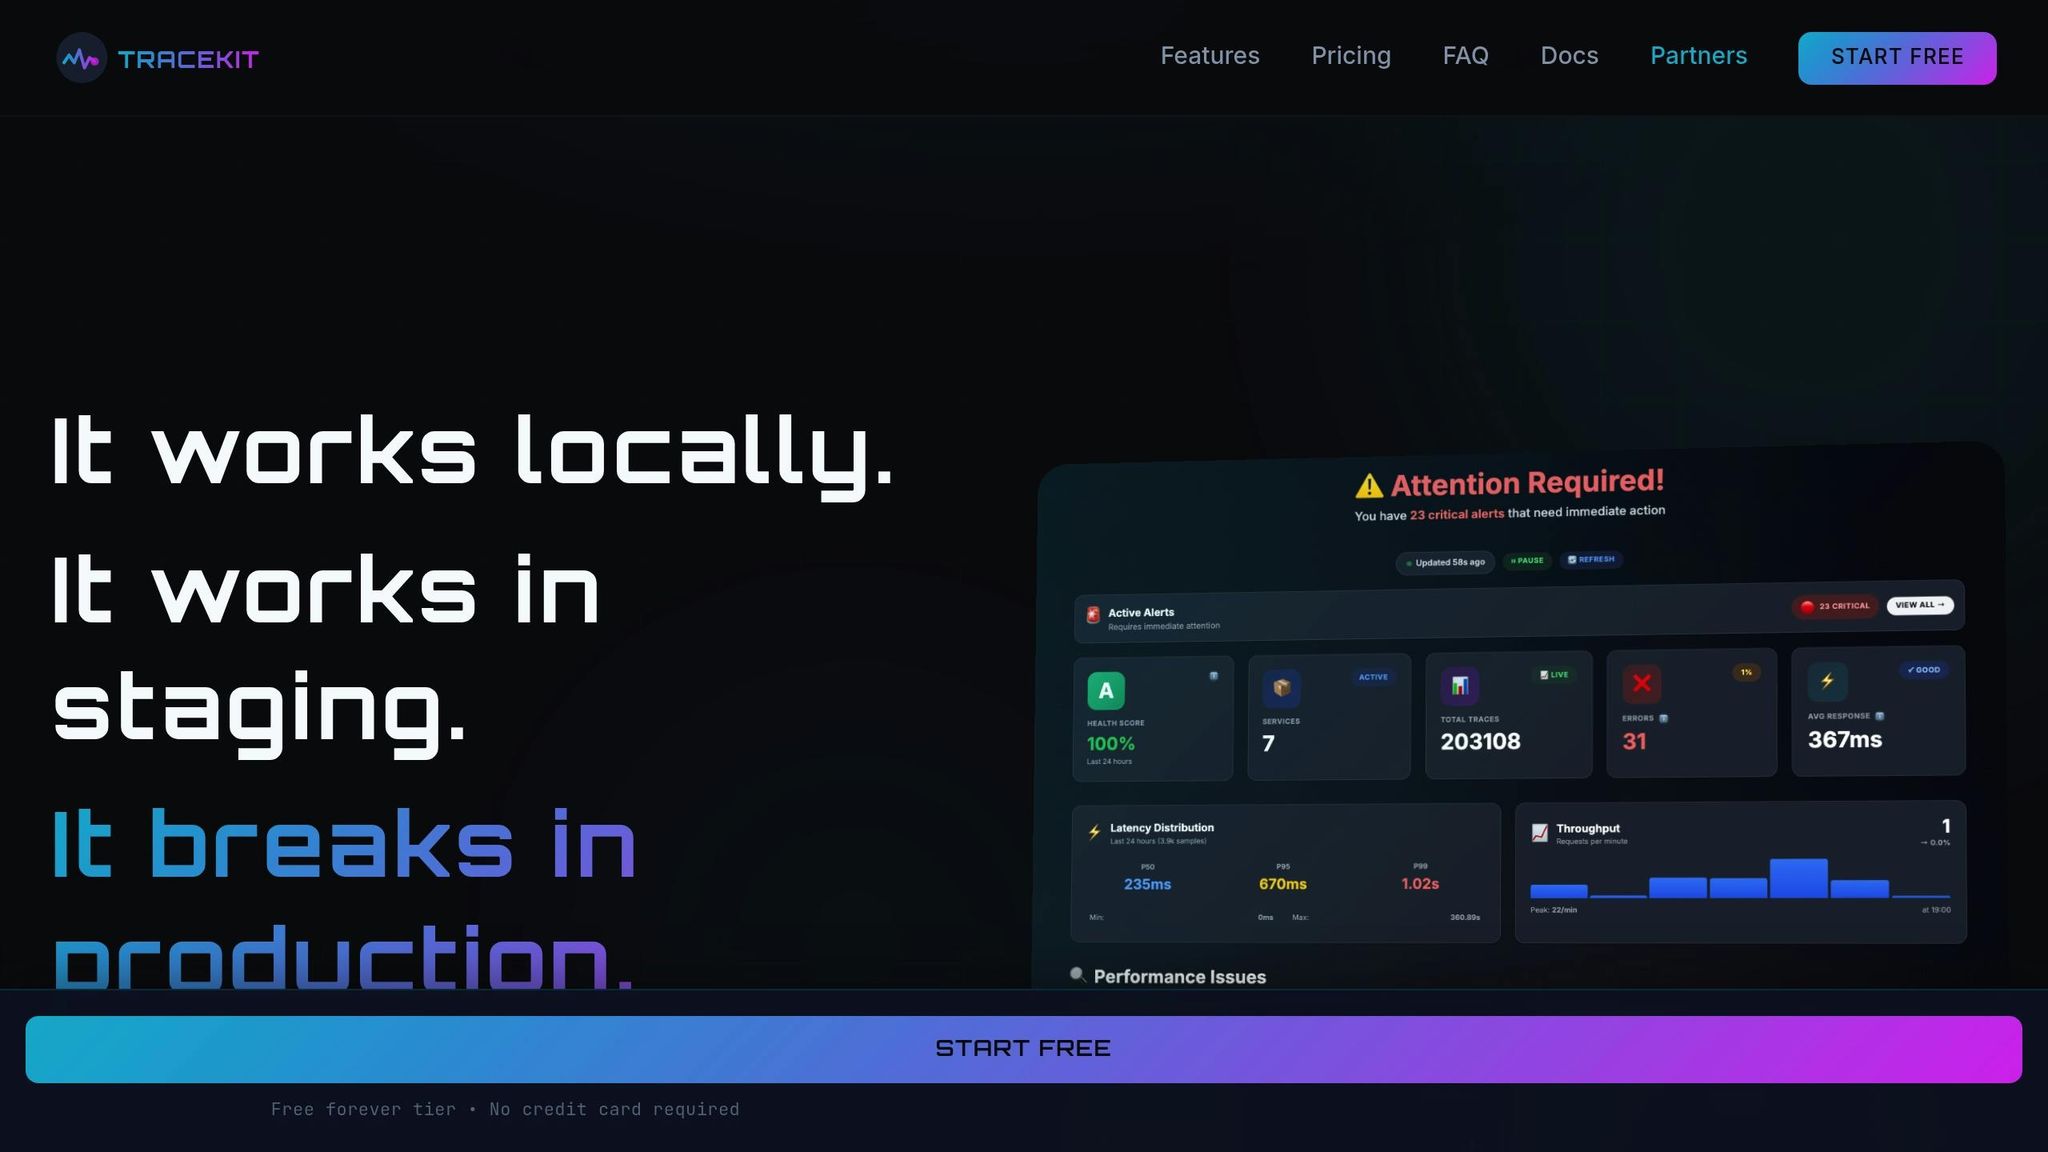
TraceKit is a APM platform built on OpenTelemetry that automatically detects performance anomalies in distributed systems using statistical Z-score analysis. Unlike simple threshold alerts, TraceKit establishes dynamic baselines for every service operation and flags deviations automatically..
Real-time anomaly detection
TraceKit uses statistical Z-score analysis to detect latency anomalies in real-time. For example, if your checkout endpoint suddenly takes 500ms instead of the normal 120ms baseline after deployment, TraceKit automatically flags it as a CRITICAL anomaly and sends immediate alerts. This allows teams to identify performance regressions and roll back problematic code quickly..
Simple integration
Setting up TraceKit is straightforward. The CLI tool tracekit init) automatically detects your framework, creates your account, and configures everything in under 60 seconds. Or install the SDK manually for PHP (Laravel), Node.js (Express/NestJS), Python (Django/Flask), Go, Java, or Ruby. Just add the middleware to your app, set your API key in .env, and TraceKit starts tracing all requests automatically - no code changes needed..
Cost-effective for small teams
TraceKit offers a generous free Hacker plan with 200,000 traces per month forever. Paid plans start at $29/month for 1M traces, $99/month for 10M traces, or $299/month for 50M traces. As a fully managed SaaS platform, there are no infrastructure costs or setup fees - you only pay for the traces you send..
Language and framework support
TraceKit works with any backend language that supports OpenTelemetry, including PHP, Node.js, Python, Go, Java, Ruby, and .NET. It's designed for distributed tracing across microservices, supporting frameworks like Laravel, Express, NestJS, Django, Flask, FastAPI, Spring Boot, and Rails. Monitor your entire polyglot system from a single dashboard..
Key features
- Adaptive baselines: TraceKit calculates P50, P95, P99, and standard deviation for each operation hourly, adapting the lookback window (1-14 days) based on traffic volume.
- Smart filtering: Exclusion rules with wildcard patterns and time-based windows prevent false positives for batch jobs and maintenance periods.
- Rate-limited alerts: Configurable cooldown periods (120min for warnings, 30min for critical) prevent alert fatigue while keeping you informed via email and webhooks.
2. Datadog Anomaly Detection
Datadog uses its Watchdog AI engine to monitor metrics, traces, and logs, automatically identifying unusual patterns. It learns baseline behaviors and flags deviations without requiring manual configuration[5].
Real-time anomaly detection capabilities
With Datadog, streaming data is constantly analyzed, and alerts are sent instantly whenever key metrics - like API response times or error rates - stray from expected norms[5]. This quick detection ensures teams can address issues as they arise, keeping systems running smoothly.
Simple integration with existing systems
Getting started with Watchdog is effortless. Once your infrastructure is connected to Datadog, the engine begins adapting right away, requiring little to no setup. This makes it an excellent choice for teams that lack dedicated DevOps resources[5].
3. New Relic Lookout
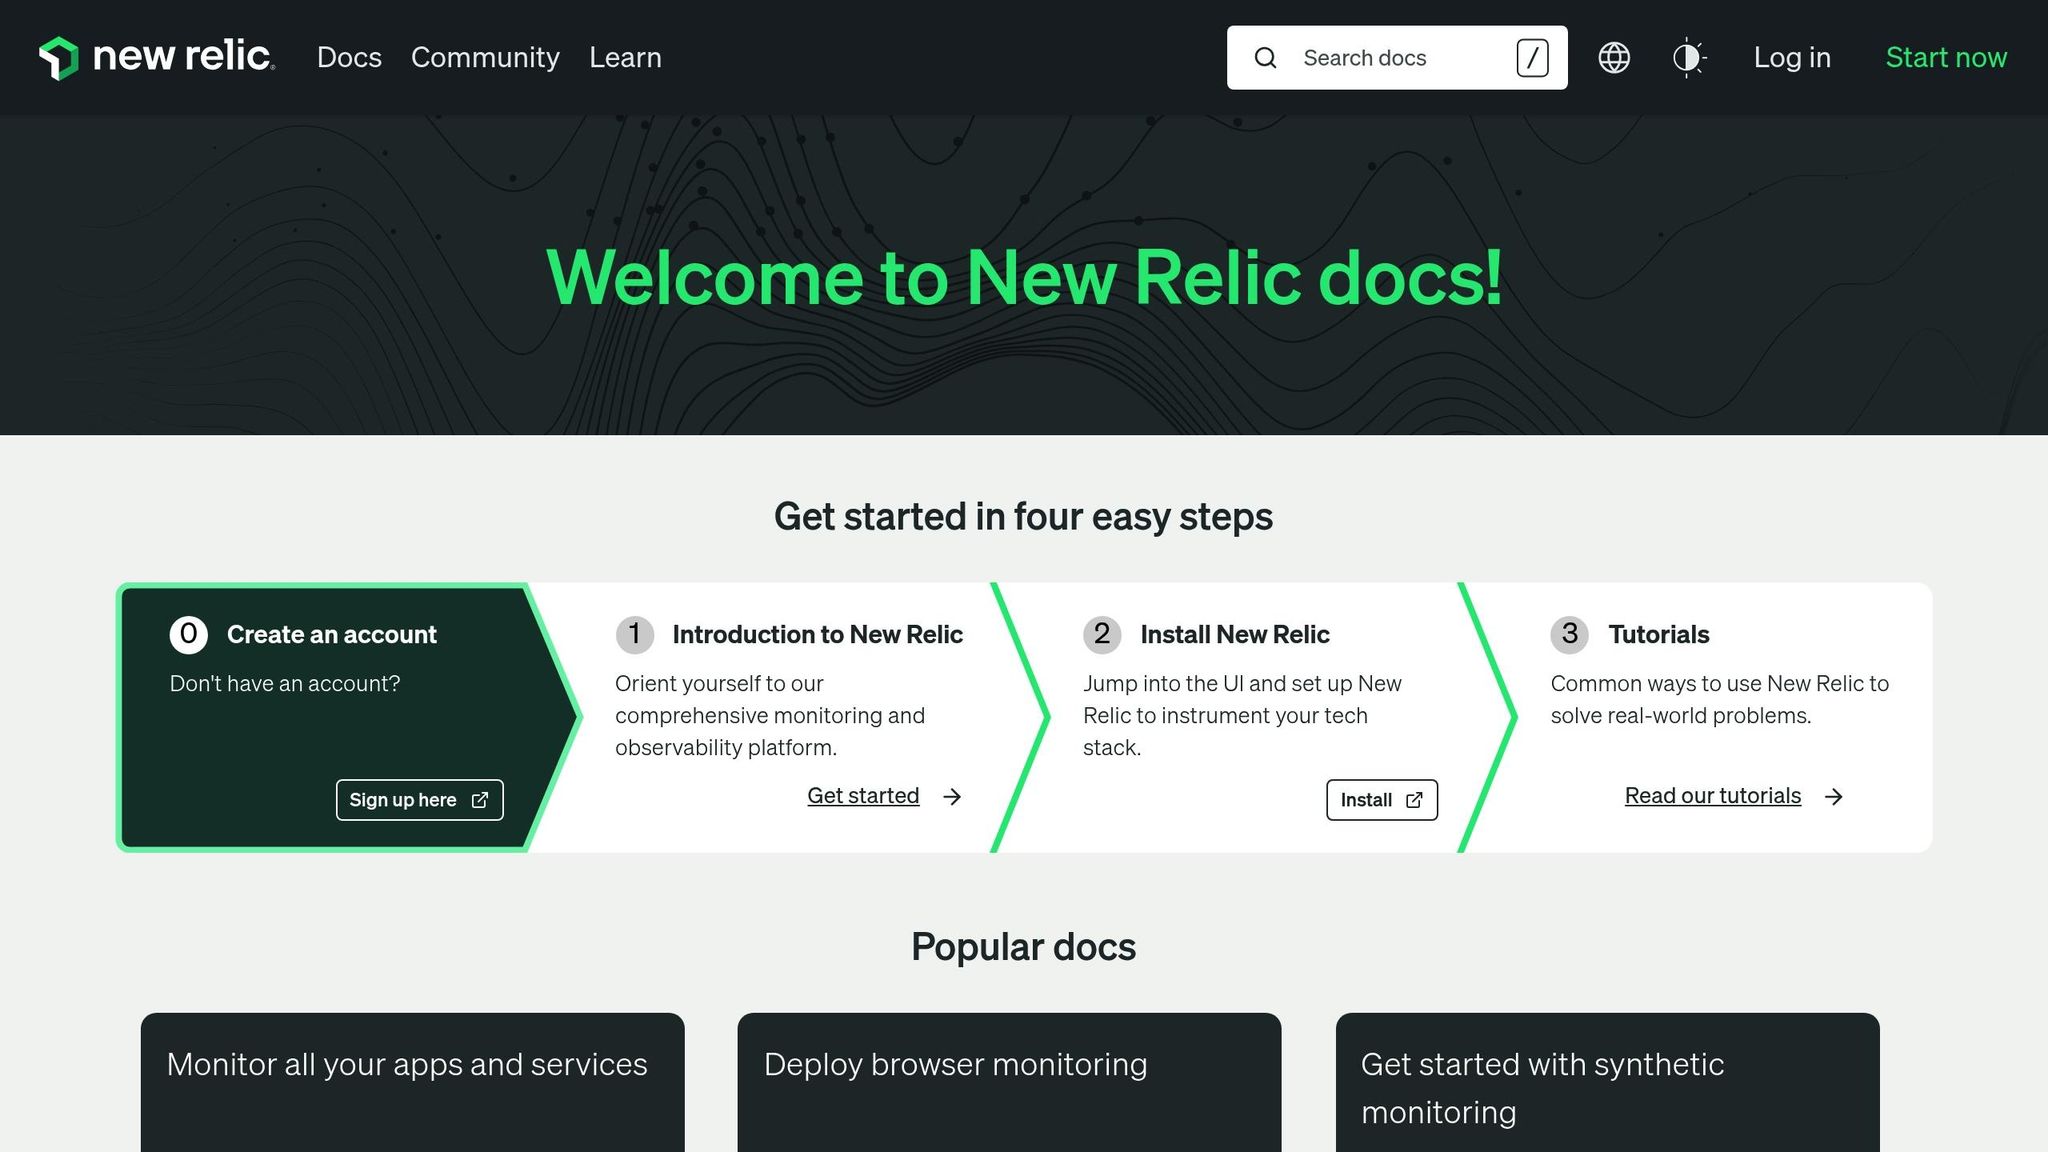
New Relic Lookout is designed to automatically scan application metrics and events, making it easier to spot anomalies. By leveraging machine learning, it establishes what "normal" looks like and flags any significant deviations from that baseline[3]. This functionality lays the groundwork for its effective real-time detection and smooth integration capabilities.
Real-time anomaly detection capabilities
Lookout processes telemetry data almost instantly, identifying critical anomalies and grouping related issues to uncover cascading problems - like how a database latency spike might lead to API errors[3]. It provides detailed context, including the specific services impacted and the changes in metrics, so you can quickly grasp the scale and nature of the issue.
Ease of integration with existing systems
New Relic Lookout fits right into the New Relic One platform without hassle[4]. If your applications are already equipped with New Relic agents, you can activate Lookout and start detecting anomalies after a brief setup period. The activation process is straightforward: enable the feature via your dashboard, configure notifications in just a few minutes, and access distributed traces, logs, and APM data with minimal effort.
Pricing model and affordability for small teams
New Relic uses a consumption-based pricing structure, where costs depend on the number of users and the amount of data ingested[4]. For smaller teams, the free tier offers core monitoring and basic anomaly detection. For more advanced needs, the Standard edition starts at approximately $99 per month and adjusts based on usage. Importantly, Lookout's anomaly detection is included as part of the platform, so there’s no need to purchase it as an extra feature[4].
Support for multiple programming languages and frameworks
New Relic supports a wide range of programming languages, including Java, .NET, Node.js, Python, Ruby, PHP, and Go, as well as popular frameworks like Spring, Django, Express, and ASP.NET[4]. It also integrates with Linux and Windows hosts, containers, Kubernetes, and major cloud platforms like AWS, Azure, and GCP. This extensive compatibility allows small teams working with diverse tech stacks to monitor their entire infrastructure with ease.
4. Anodot
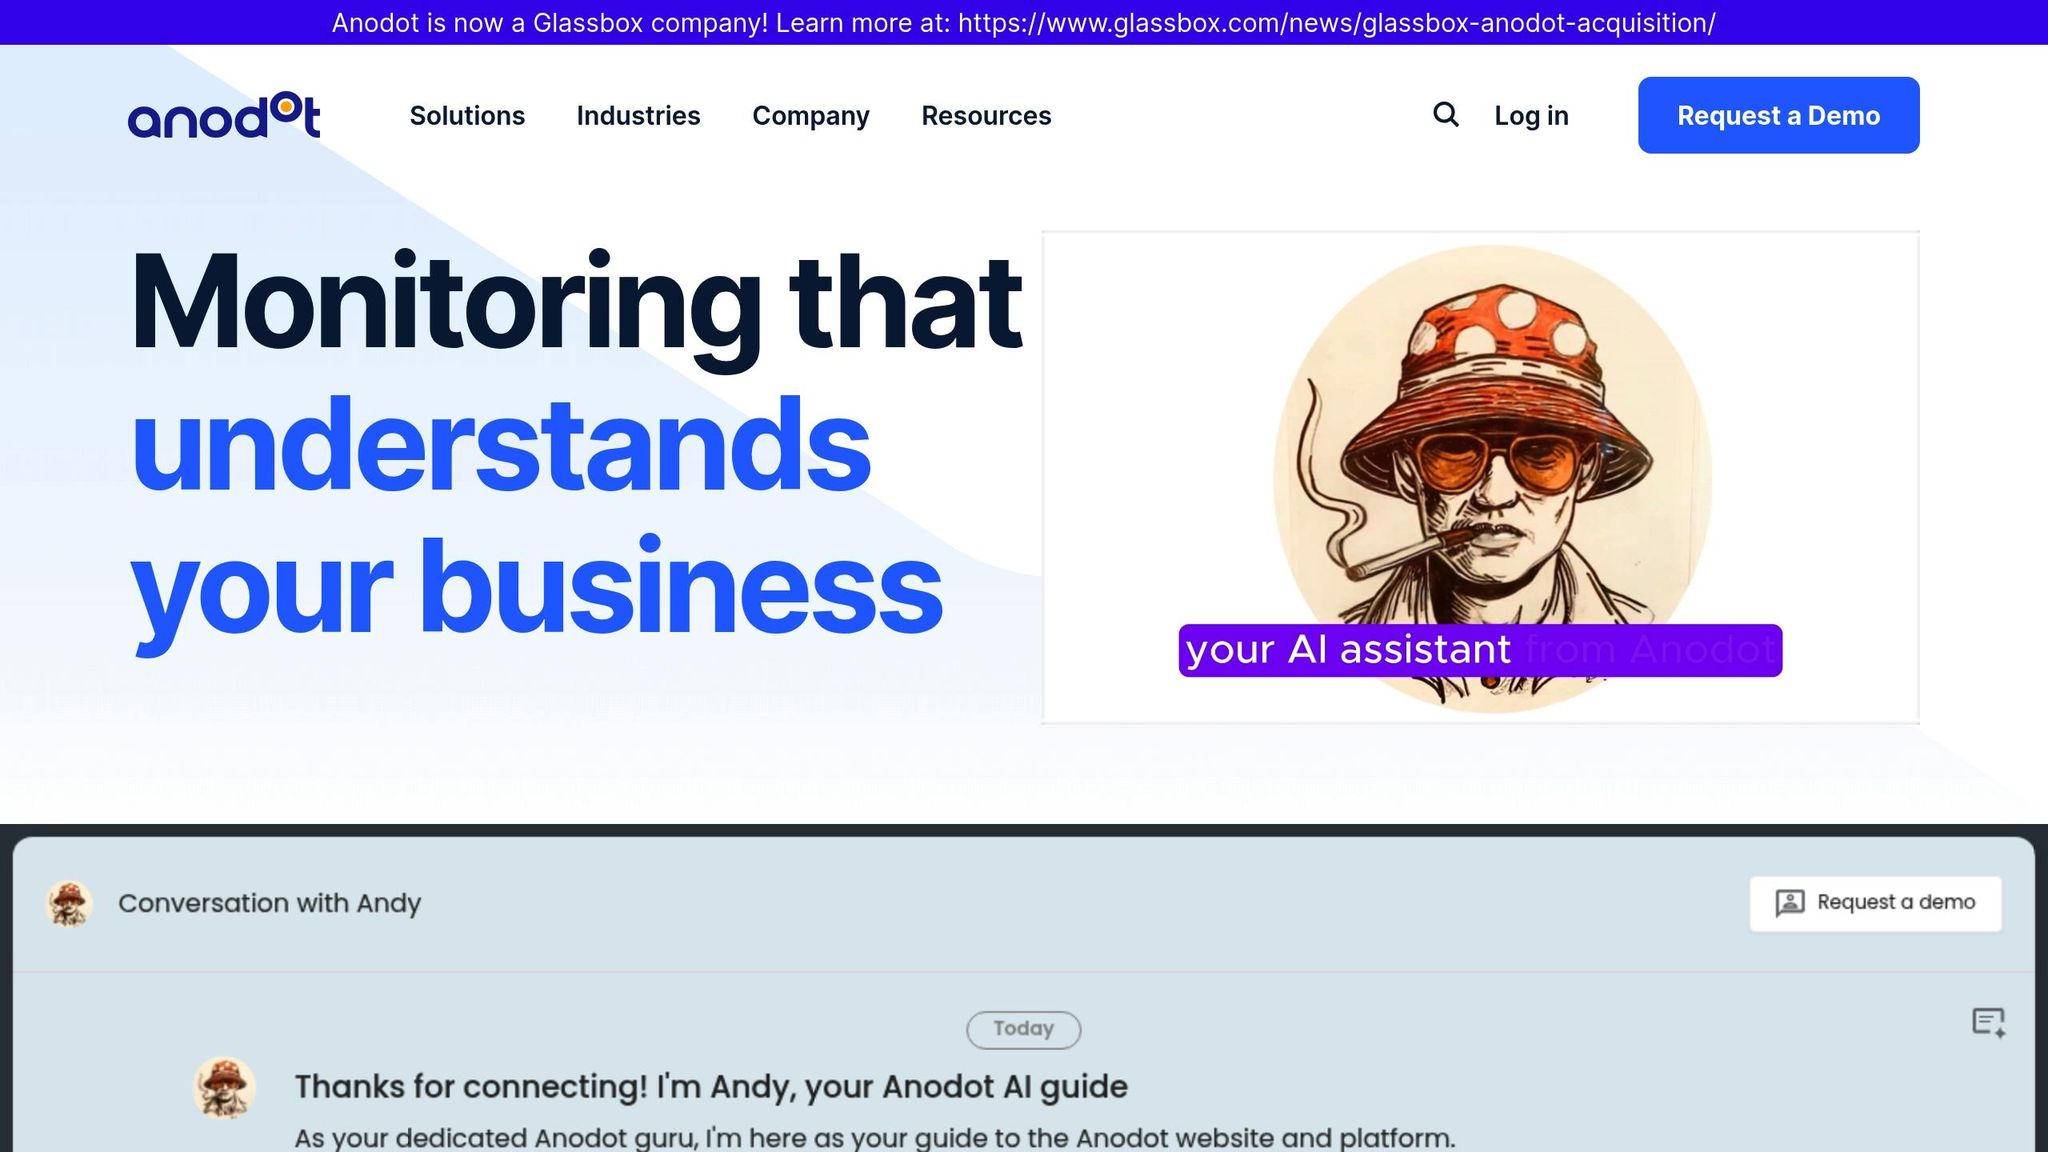
Anodot is a SaaS platform designed to automate anomaly detection through the use of unsupervised machine learning algorithms [5][6][7]. Unlike tools that require you to manually configure thresholds, Anodot analyzes your data streams to understand what normal behavior looks like, factoring in seasonality and trends [5]. When something falls outside these expected patterns, it sends you alerts - no need for complex rule setups. This system ensures you’re notified the moment performance metrics veer off course.
Real-time anomaly detection capabilities
Anodot continuously monitors and analyzes metrics in real time. Its ability to automatically detect outliers across business and operational data means small teams can quickly identify issues like unexpected traffic drops, revenue inconsistencies, or infrastructure hiccups as they happen [5].
Seamless integration with existing systems
The platform supports a wide range of integrations, offering connectors for databases, data lakes, message queues, SaaS applications, streaming sources, and REST APIs [5]. Its user-friendly interface allows business users to navigate easily, while data teams typically manage the integration process. By consolidating metrics from marketing, sales, and IT into one system, Anodot provides a unified platform accessible by BI, R&D, and DevOps teams [6][7]. The quick setup process and scalable architecture make it especially appealing for smaller teams looking to optimize costs.
Pricing model and suitability for small teams
Anodot’s scalable SaaS model is designed to accommodate various team sizes and needs. While pricing isn’t publicly available, user feedback suggests a high level of satisfaction [6]. Small teams are encouraged to contact Anodot directly to explore pricing options that align with their specific data volume and operational requirements.
5. Splunk Machine Learning Toolkit (MLTK)
Splunk Enterprise's Machine Learning Toolkit (MLTK) is designed to analyze raw data for detecting anomalies that could indicate security threats [7][6]. By sending your raw data to Splunk Enterprise, the toolkit gets to work, scanning for irregularities that might signal potential risks.
Real-time Anomaly Detection Capabilities
Splunk's GenAI Assistant enhances incident investigation by providing guided debugging support. However, it doesn't automatically flag every anomaly, which may limit its proactive capabilities [8]. That said, Splunk’s ability to integrate smoothly with existing systems ensures it remains a valuable tool for security teams.
Seamless Integration with Existing Systems
Integrating Splunk into your current infrastructure is straightforward. Splunk Enterprise can ingest raw data directly, while the Observability Cloud automatically generates service maps to visualize your system architecture [8]. This setup minimizes the need for manual configuration, making it easier for teams to understand how different components in their system interact. The platform also supports commonly used programming languages, adding to its flexibility [6].
Pricing Model and Considerations for Small Teams
Splunk Observability Cloud operates on a per-host pricing model, with costs ranging from $60 to $75 per host per month [8]. However, for small teams managing dynamic, container-heavy environments, expenses can add up quickly. For example, a Kubernetes cluster with 100 pods across 20 nodes could cost between $1,200 and $1,500 per month, not including data retention fees [8]. User feedback reflects mixed experiences, with Splunk Enterprise earning an Editor Rating of 8.2 and an Aggregated User Rating of 6.5 based on 15 reviews [6].
6. Azure AI Anomaly Detector
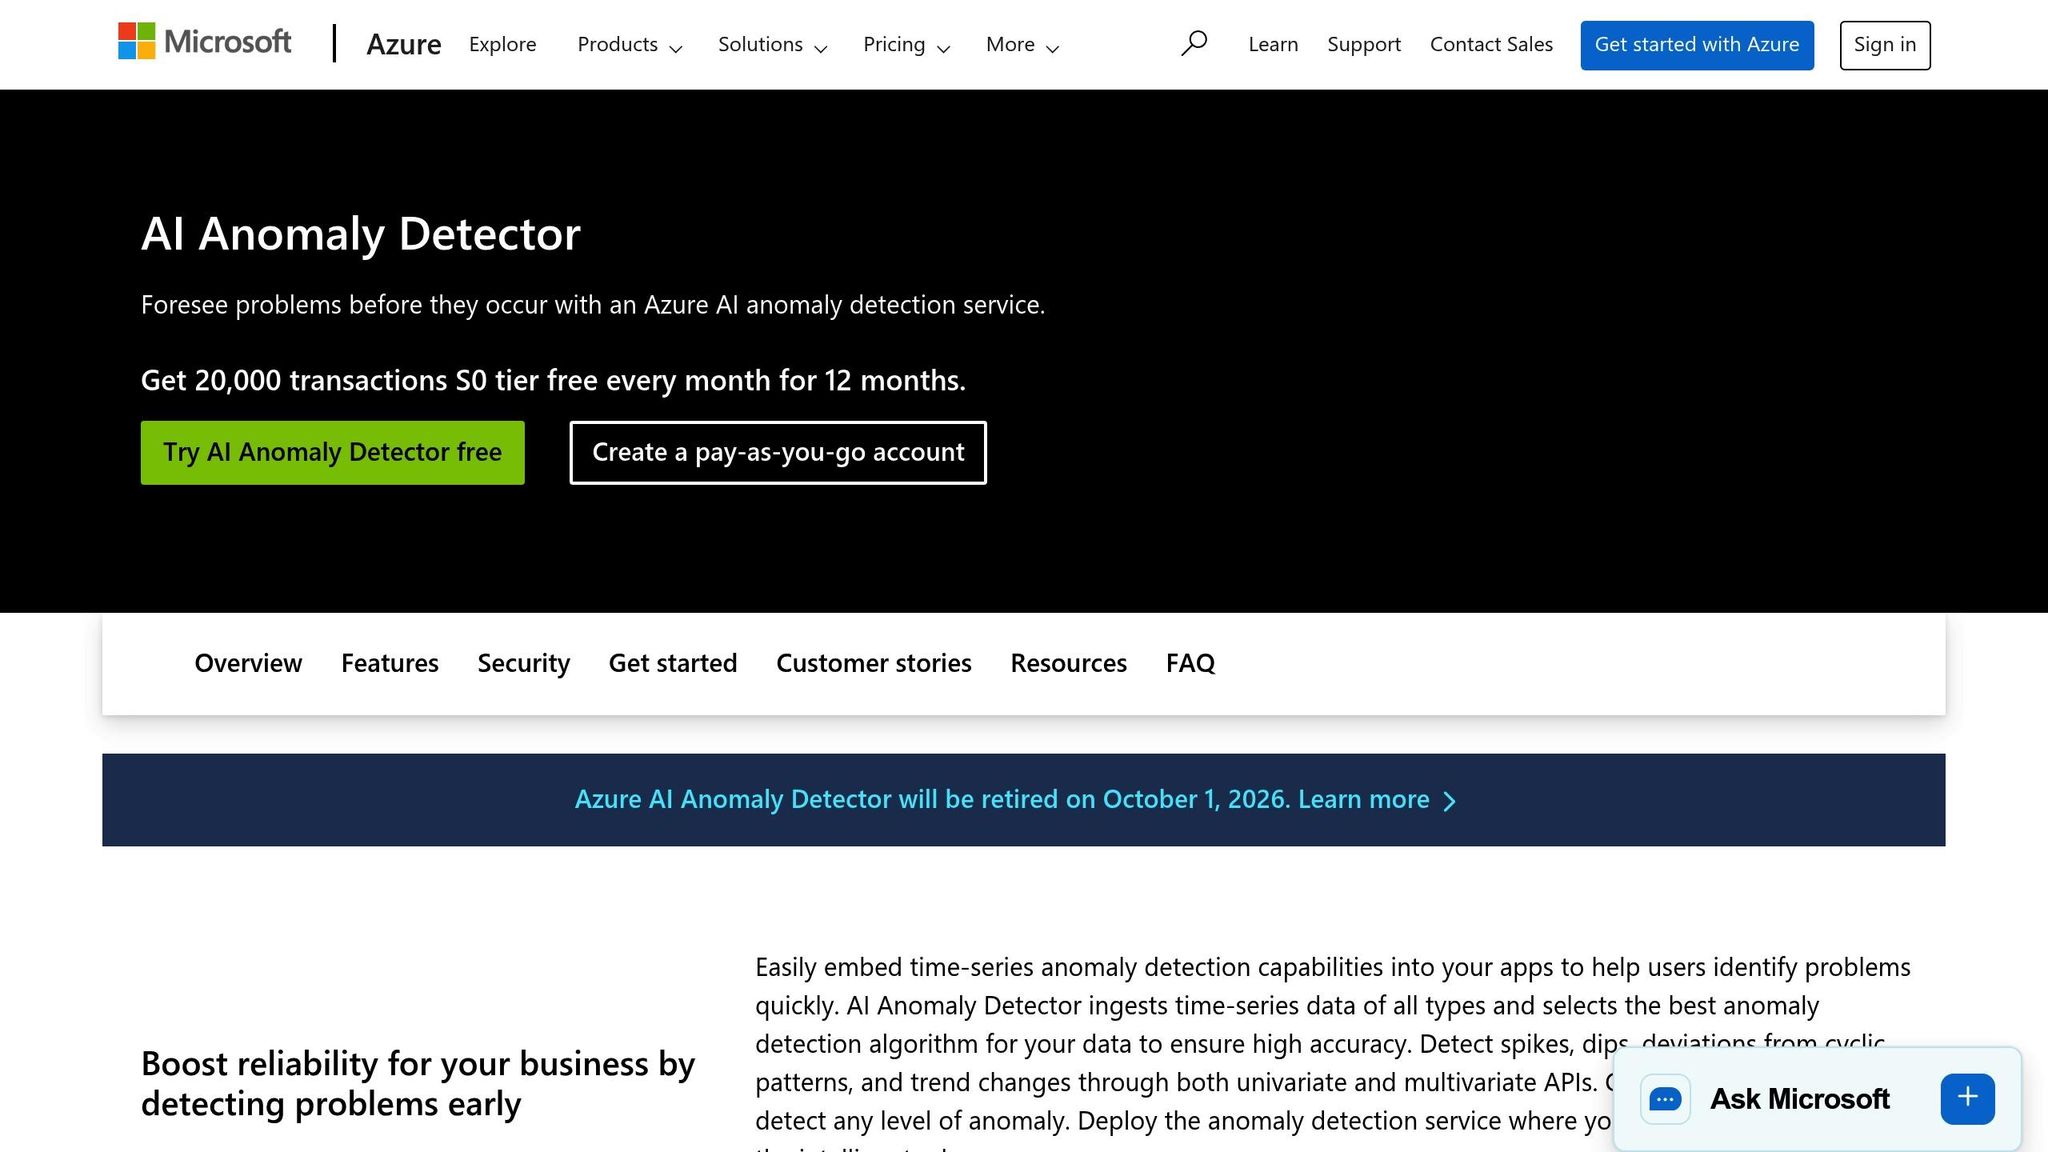
Note: Azure AI Anomaly Detector is set to be retired on October 1, 2026 [9]. If you're part of a smaller development team, it's important to plan ahead and consider migration strategies if you're thinking of using it as a long-term solution.
Real-time Anomaly Detection Capabilities
Azure AI Anomaly Detector is designed to analyze time-series data, automatically selecting the most suitable algorithm to deliver accurate results. It can identify spikes, dips, deviations from recurring patterns, and shifts in trends - all without requiring labeled training data. This feature allows teams to focus on addressing issues as they occur, rather than spending time on data preparation. For smaller teams, the service is particularly convenient, as it can be integrated with minimal coding effort, speeding up problem resolution [9].
The tool is well-suited for industries like finance, e-commerce, and IoT, where real-time anomaly detection is critical [7]. Additionally, its pricing structure is designed to accommodate smaller teams, making it accessible without breaking the budget.
Pricing Model and Affordability for Small Teams
Azure AI Anomaly Detector provides a free S0 tier that includes up to 20,000 transactions per month for the first 12 months. For new Azure accounts, there’s also a $200 credit available for 30 days, along with free allocations of popular services and access to over 55 services that remain free indefinitely [9].
Tool Comparison Table
The table below highlights essential factors like setup speed, detection capabilities, pricing, language support, and team suitability for small development teams. It serves as a quick reference to help identify the best tool for your specific needs. live debugging
| Tool | Setup Speed | Detection Speed | Pricing Structure | Language/Framework Support | Best For |
|---|---|---|---|---|---|
| TraceKit | Very low (zero‑configuration) | Yes, with automatic alerts | $29/month (1M traces), $99/month (10M traces), $299/month (50M traces) | PHP, Node.js, Go, Python, Java, Ruby, etc | Small teams needing |
| Datadog Anomaly Detection | Low (out‑of‑the‑box with a 2–6 week training period) | Yes, after establishing a baseline | Usage‑based pricing | Extensive multi‑language support | Teams able to invest in initial model training |
| New Relic Applied Intelligence | Very low (enable with a few clicks) | Yes, immediate detection | Usage‑based pricing; free tier available | Multi‑language support | Ops generalists without requiring data science expertise |
| Anodot | Very low (autonomous; hours to days) | Yes, immediate | Custom pricing; contact sales | API‑based integration | Teams seeking a fast time to value |
| Splunk MLTK | Moderate (requires configuration) | Yes (requires guided prompting) | Enterprise pricing; contact sales | Broad platform support | Teams with an existing Splunk infrastructure |
| Azure AI Anomaly Detector | Low (minimal code required) | Yes, with automatic algorithm selection | Free tier available, then usage‑based | REST API, language‑agnostic | Teams in the Azure ecosystem |
Some tools stand out for their simplicity and speed. For instance, Anodot offers an autonomous setup that delivers results in just hours or days, requiring no machine learning expertise [5]. Similarly, Azure AI Anomaly Detector simplifies the process by automatically selecting the best algorithm without needing labeled training data [9]. New Relic Applied Intelligence makes anomaly detection accessible with just a few clicks, perfect for teams without data science skills [5][8].
For small teams, tools that provide immediate detection with minimal setup effort are ideal. While Datadog Watchdog is ready to use out of the box, it does require a 2–6 week training period for its models to become fully effective [5][8]. To save time during implementation, prioritize tools with intuitive user interfaces, straightforward APIs, and clear integration guides [5].
Ultimately, selecting a tool that reduces configuration time while delivering real-time insights can make a significant difference for small teams managing tight schedules and resources.
Conclusion
Finding the right anomaly detection tool is all about aligning your team's specific needs with what each platform can deliver. The best choice will depend on your goals, resources, and how well the tool integrates into your workflow.
As mentioned earlier, technical performance and pricing are crucial factors. For example, TraceKit starts at $29/month, making cost a key consideration. Look for tools offering free tiers or trials so you can explore features without committing upfront [8][2].
Ease of setup and time to value also vary widely. Some platforms deliver instant results using statistical methods, while others may require days or even weeks of baseline training to operate effectively [8]. If your team is short on time or lacks machine learning expertise, prioritize tools with strong AutoML features, user-friendly interfaces, and minimal setup requirements [5][10]. Tools like TraceKit, with zero-configuration, and Anodot, with autonomous setup, can save valuable time [5]. Additionally, ensure the tool integrates seamlessly with your existing databases, data warehouses, streaming platforms, and alert systems. Well-documented APIs and clear integration guides can make implementation much smoother [5]. If your team already uses platforms like Azure or specific observability tools, sticking within that ecosystem can help reduce friction.
Vendor stability and long-term support are equally important. Investigate the vendor's roadmap and overall reliability to avoid investing in a tool that might be discontinued or significantly altered down the line [8][9]. Define measurable success metrics - such as False Positive Rate and False Negative Rate - early on to objectively evaluate and compare tools, as highlighted in the tool comparison table, ensuring they meet your operational requirements.
FAQs
What should small development teams look for in an anomaly detection tool?
When choosing an anomaly detection tool, small teams need to focus on two key factors: affordability and user-friendliness. The tool should align with their budget and be straightforward enough to avoid the need for extensive training. It's also important to find a solution that integrates smoothly with current systems and can grow with their needs.
Features like AI-driven detection are particularly valuable, as they can quickly pinpoint irregularities and make debugging faster and more efficient. A tool that simplifies monitoring and delivers clear, actionable insights can save small teams valuable time, letting them concentrate on building and improving their applications.
What are the differences in real-time anomaly detection capabilities across these tools?
Real-time anomaly detection tools come in all shapes and sizes, and their methods can differ greatly. Some systems use statistical algorithms to flag irregularities as they happen, offering immediate alerts. Others lean on machine learning models, which might need some time to learn and adapt for better accuracy.
The more advanced solutions take it a step further with causal AI and topology awareness. These tools map out how different parts of a system interact, pinpointing how issues spread. This can provide sharper root-cause analysis, making it easier for smaller teams to troubleshoot quickly and efficiently.
What are the costs of using anomaly detection tools for small development teams?
The price of anomaly detection tools for small development teams can differ based on factors like included features, pricing structure, and the size of the team. Many tools offer tiered pricing, with basic plans often starting at less than $100 per month. Additionally, some tools provide free tiers or trial periods, allowing small teams to test them out without any upfront costs.
However, the subscription fee is just one part of the equation. Consider the potential savings these tools can deliver: improved debugging efficiency, quicker issue resolution, and minimized downtime. For teams operating with tight budgets, these advantages can make the expense a smart and practical choice.
Related Blog Posts
Related Posts

TraceKit vs Datadog: Which APM for Small Teams?
TraceKit vs Datadog for small teams: $29/month vs $500+. Compare setup time, features, pricing, and see how one startup saved $46,200/year switching.

Application Monitoring vs Observability: Key Differences
Explore the key differences between application monitoring and observability, and learn how they work together to enhance system reliability.

New Relic Alternative for Bootstrapped Startups
New Relic alternative for bootstrapped startups. Distributed tracing and live debugging starting at $29/month instead of $500+. 5-minute setup.