Stop the CI/CD Cycle of Death
Debug production issues in seconds, not days.
See the complete context without adding a single log statement.
TraceKit gives you Datadog-quality distributed tracing
at 1/10th the price, with zero pricing anxiety.
You're Tracking Down a Bug.
The One Log You Need Isn't There. Dead End.
Sound familiar? You need to add a log statement, so you:
Create a PR
Write the log statement and push your changes
Wait for Approval
Code review takes time...
Merge to Main
Finally approved and merged
Deploy via CI/CD
Wait for the deployment pipeline
Check the Logs
...Only to discover you need ANOTHER log statement 😫
Repeat. For hours. Sometimes days.
This is the reality of production debugging with traditional logging. You're flying blind, guessing what context you'll need before problems occur.
At scale—with containers, microservices, and distributed systems—this guessing game becomes impossible.
What If Every Request
Already Had The Context You Need?
TraceKit automatically captures the complete journey of every request
through your system. No guessing. No manual instrumentation.
The exact sequence of events that led to the error
See the full story, not just the symptoms
Which service actually caused the failure
No more guessing which microservice is the culprit
Why it only happens for some users
User context and session data included automatically
What data was involved
Request parameters, headers, and metadata captured
How long each step took
Sub-millisecond precision timing for every span
Everything You Need. Nothing You Don't.
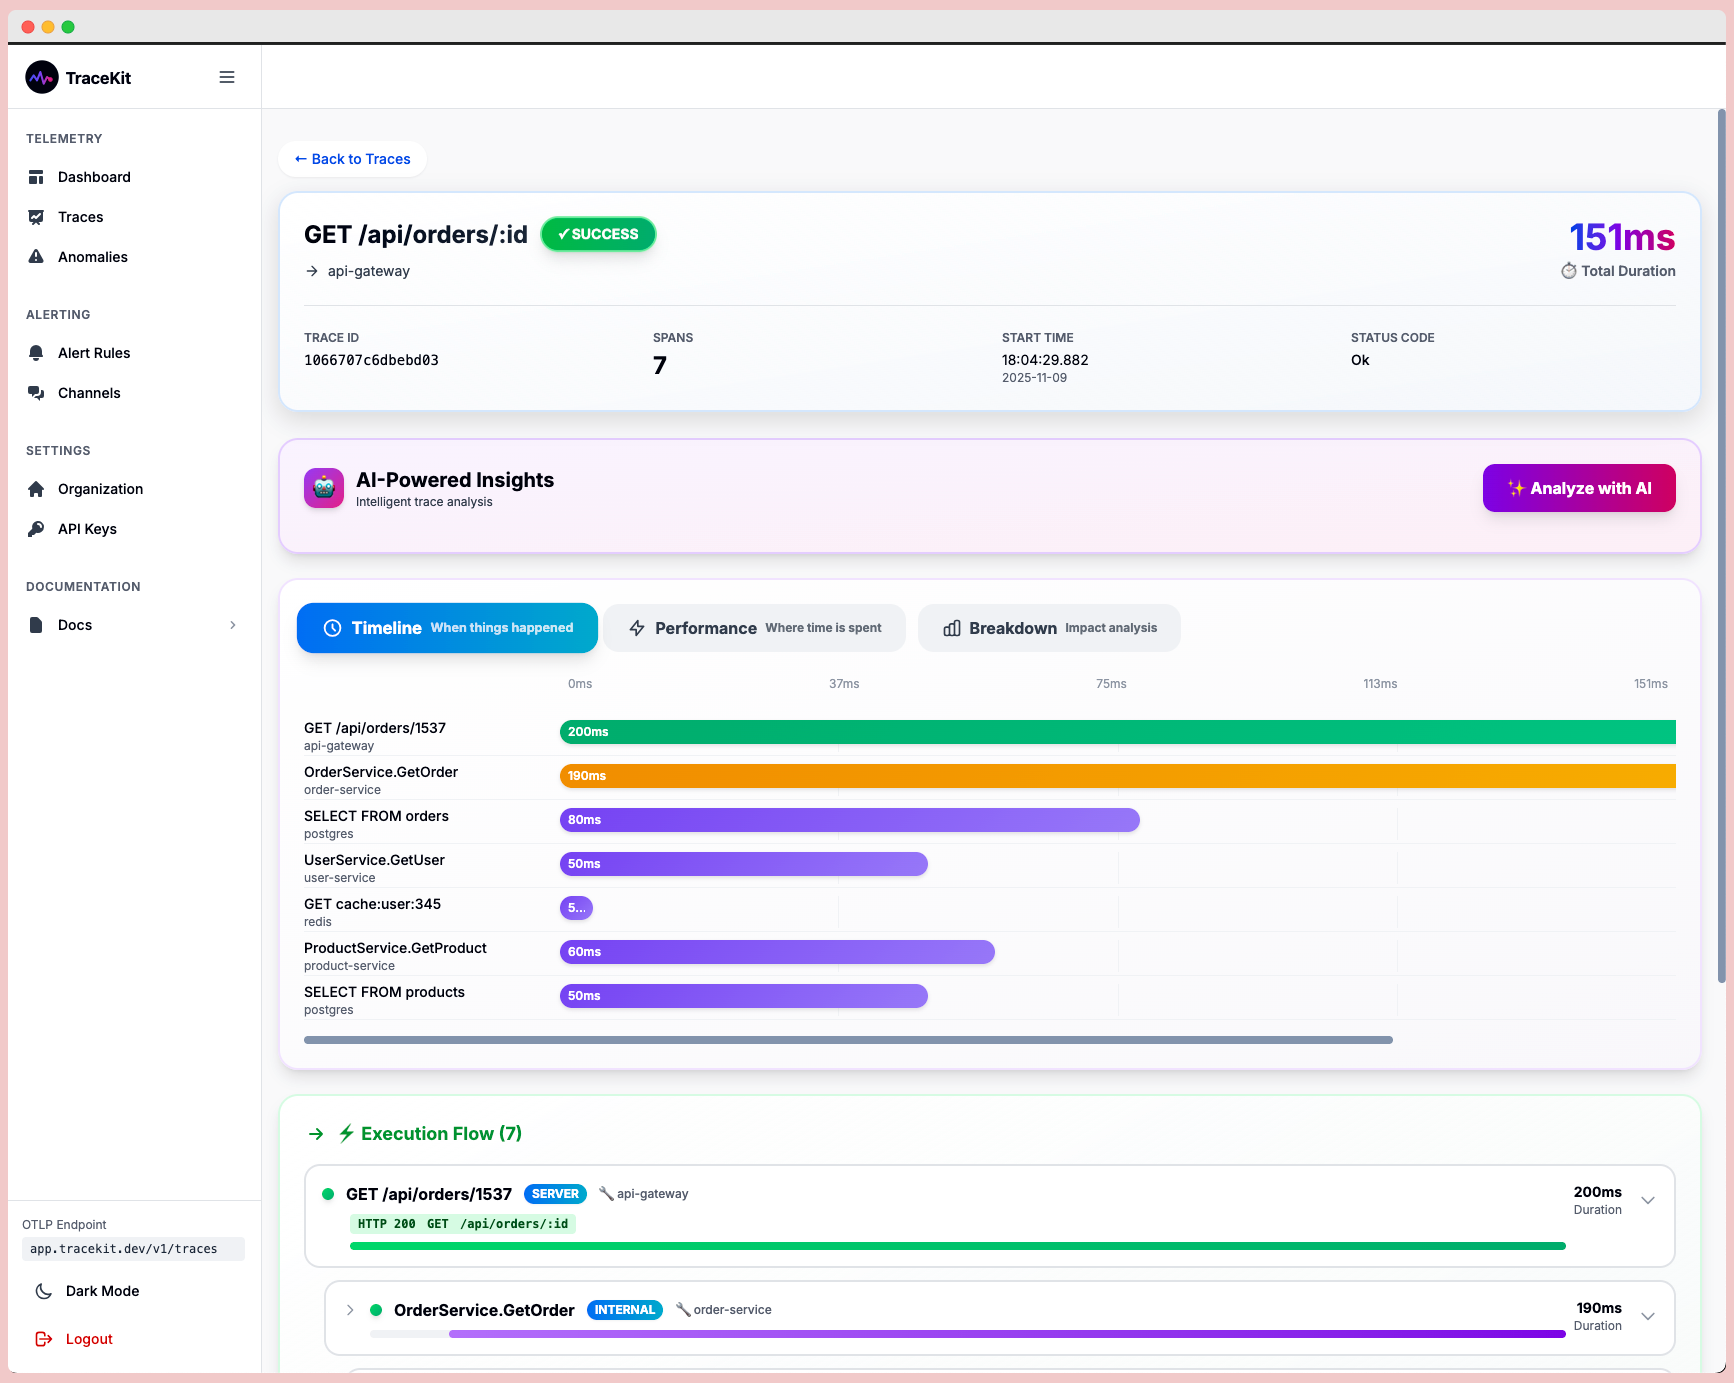
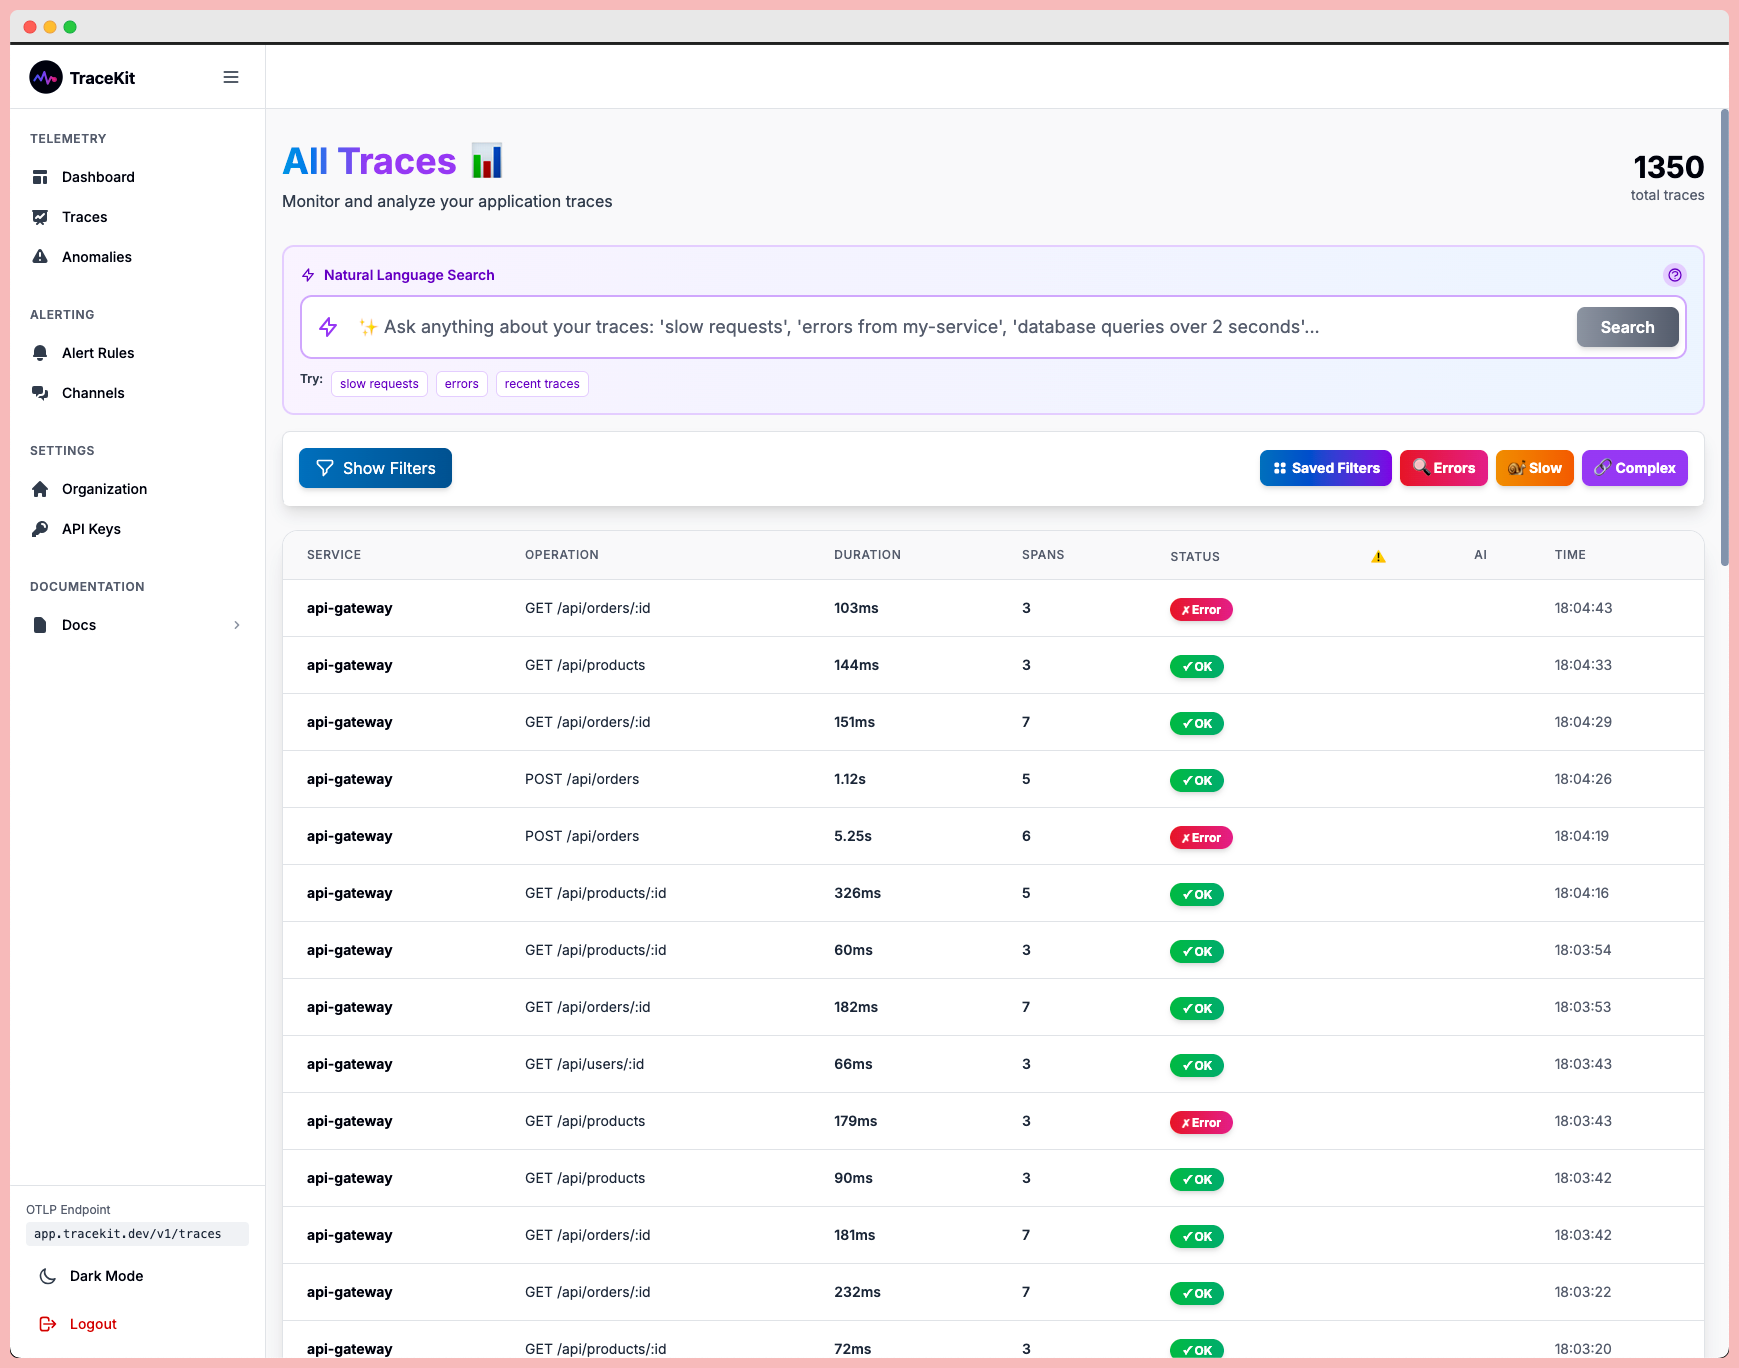
Automatic Distributed Tracing
See the Full Picture
Every request is automatically traced across all your services. No manual instrumentation. No predicting what to log. Just complete context when you need it.
- Automatic instrumentation for Laravel, Express, NestJS, and more
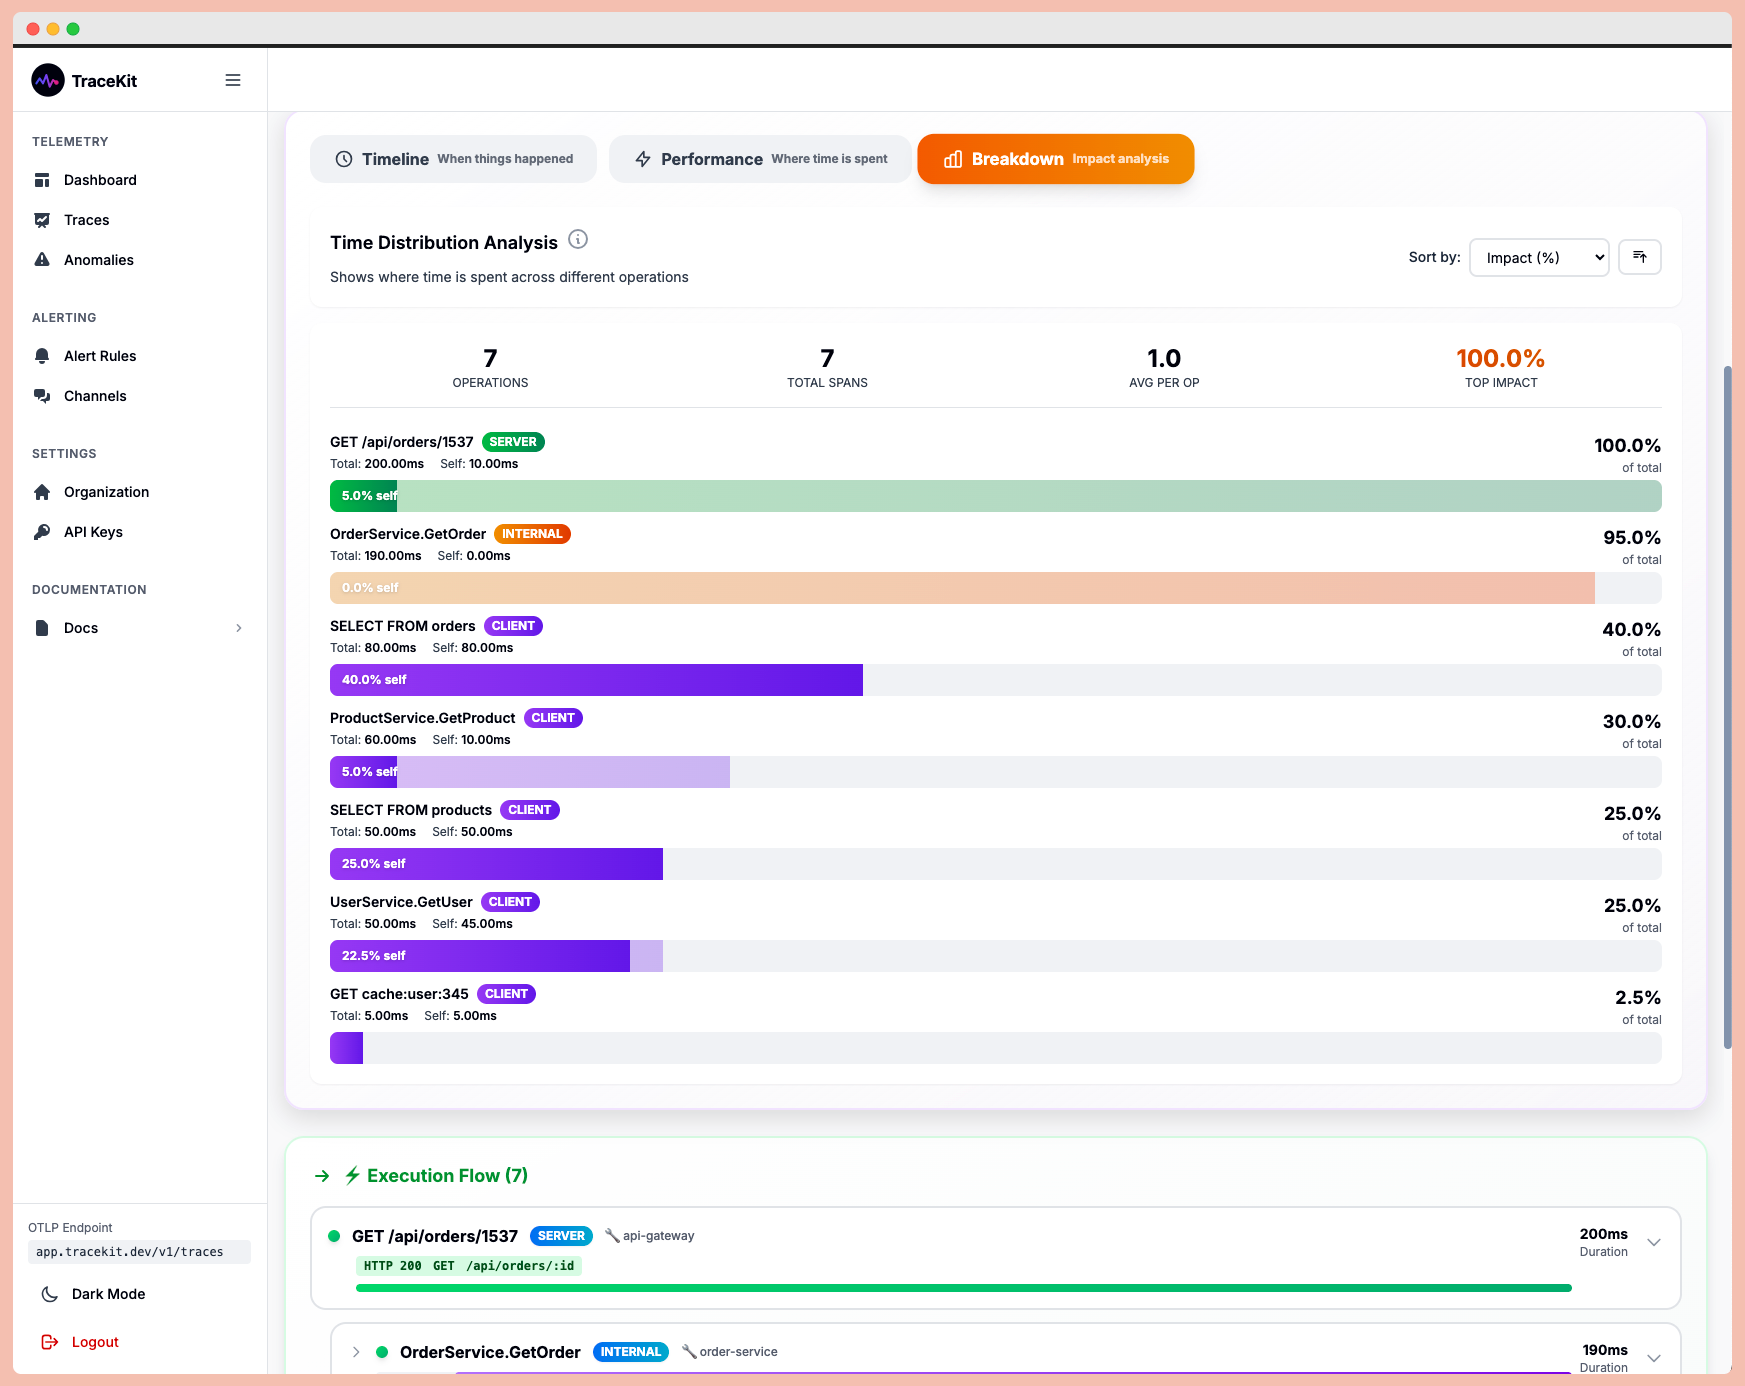
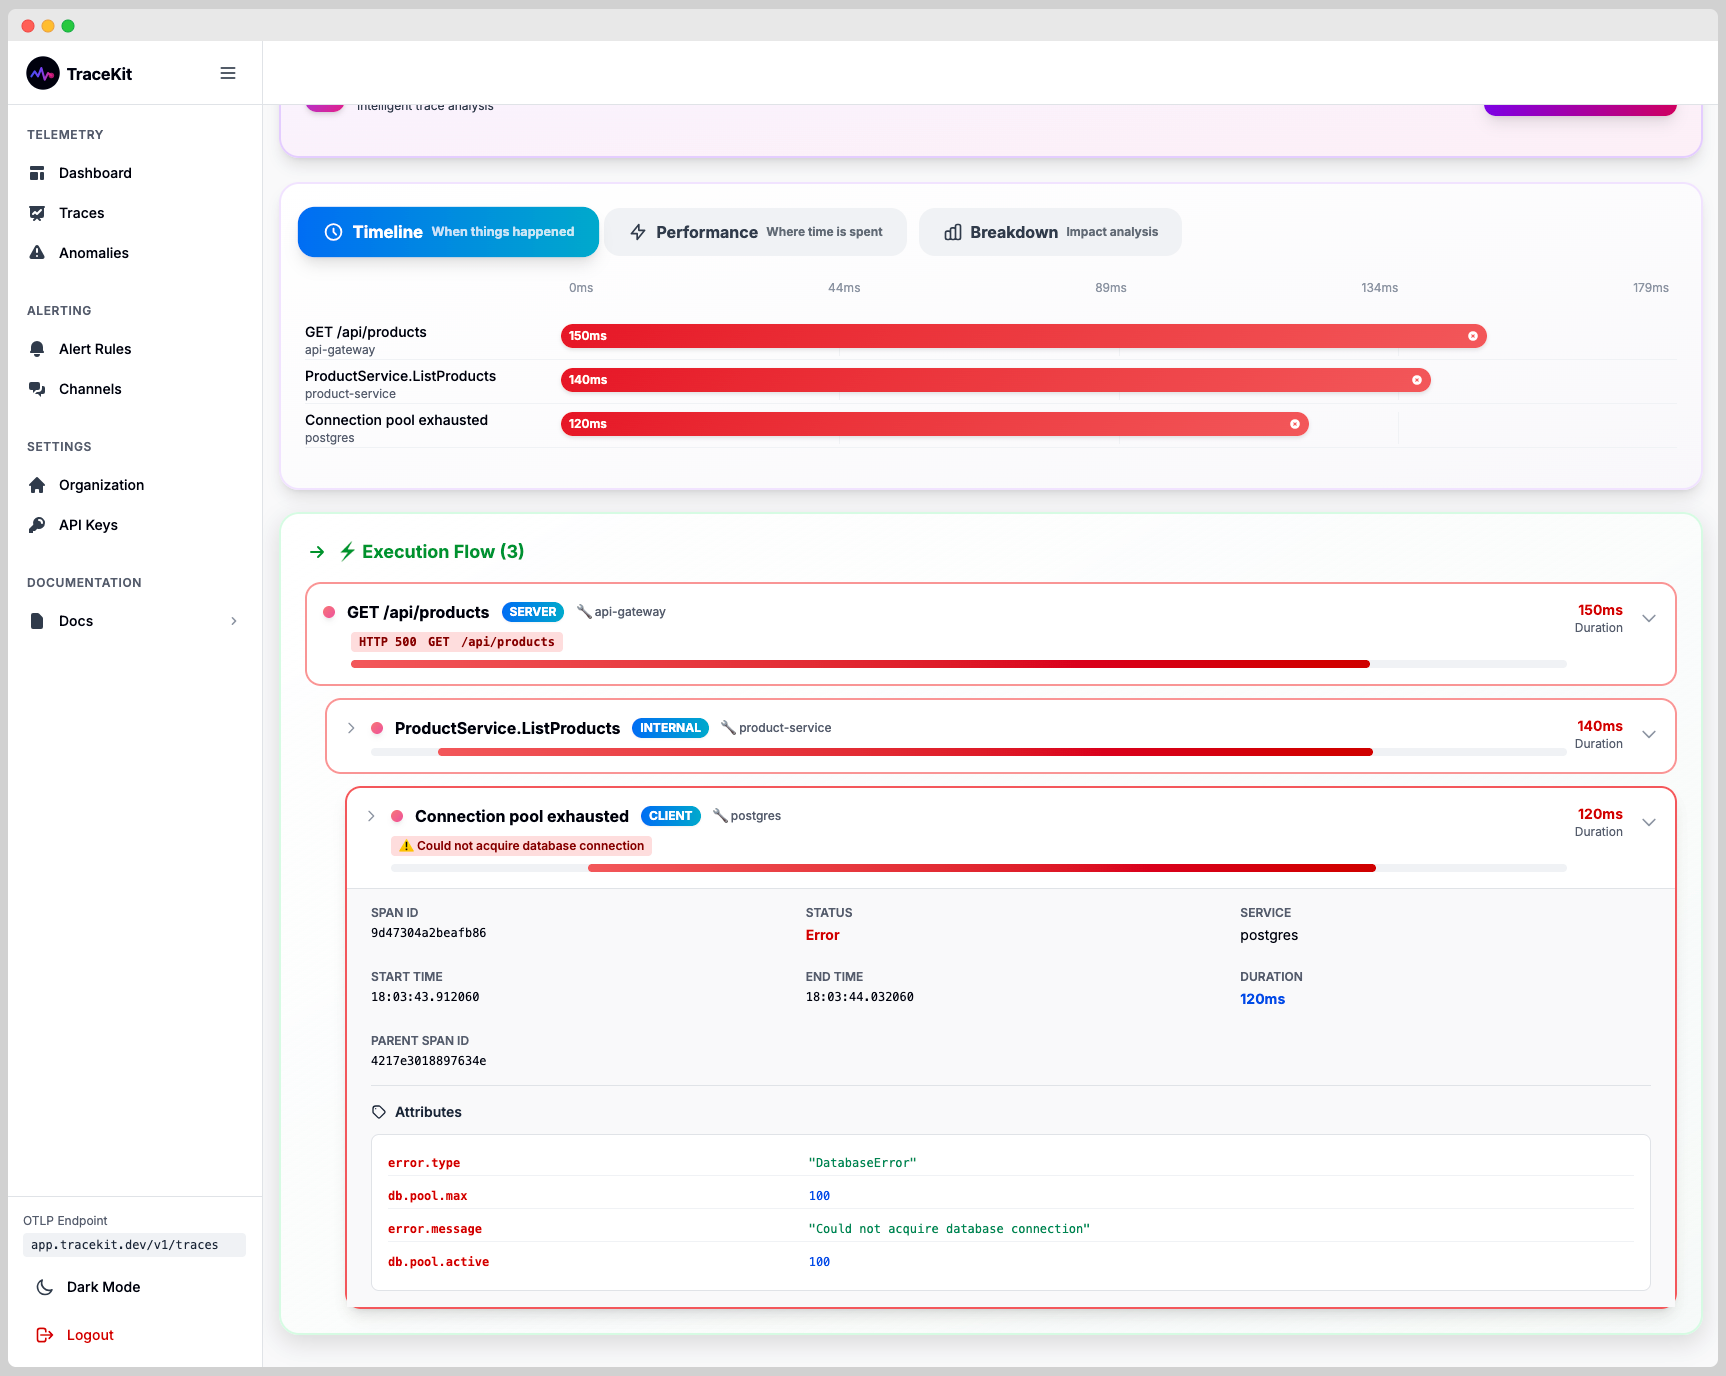
- Flame graphs show exactly where time is spent
- Service dependency maps reveal cascading failures
- Sub-millisecond precision timing
Instant Context, Not Log Diving
Debug 10x Faster
Stop spending 30-90 minutes per customer-reported issue manually correlating logs across services. Click the trace. See everything. Fix it.
- Trace-to-log correlation via trace IDs
- Automatic error linking
- Complete request metadata
- User session context
Predictable Pricing
No Surprise Bills
You know exactly what you'll pay. Every month. No host-based penalties. No custom metric surcharges. No anxiety about traffic spikes.
- Request-based pricing (not host-based)
- All OpenTelemetry metrics included
- No hidden fees
- Cancel anytime
AI-Powered Insights
Intelligent Trace Analysis
Let AI analyze your traces and surface critical issues, performance bottlenecks, and actionable recommendations automatically.
- Automatic issue detection and severity ranking
- Performance optimization suggestions
- Root cause analysis with recommendations
- Key insights highlighted in every trace

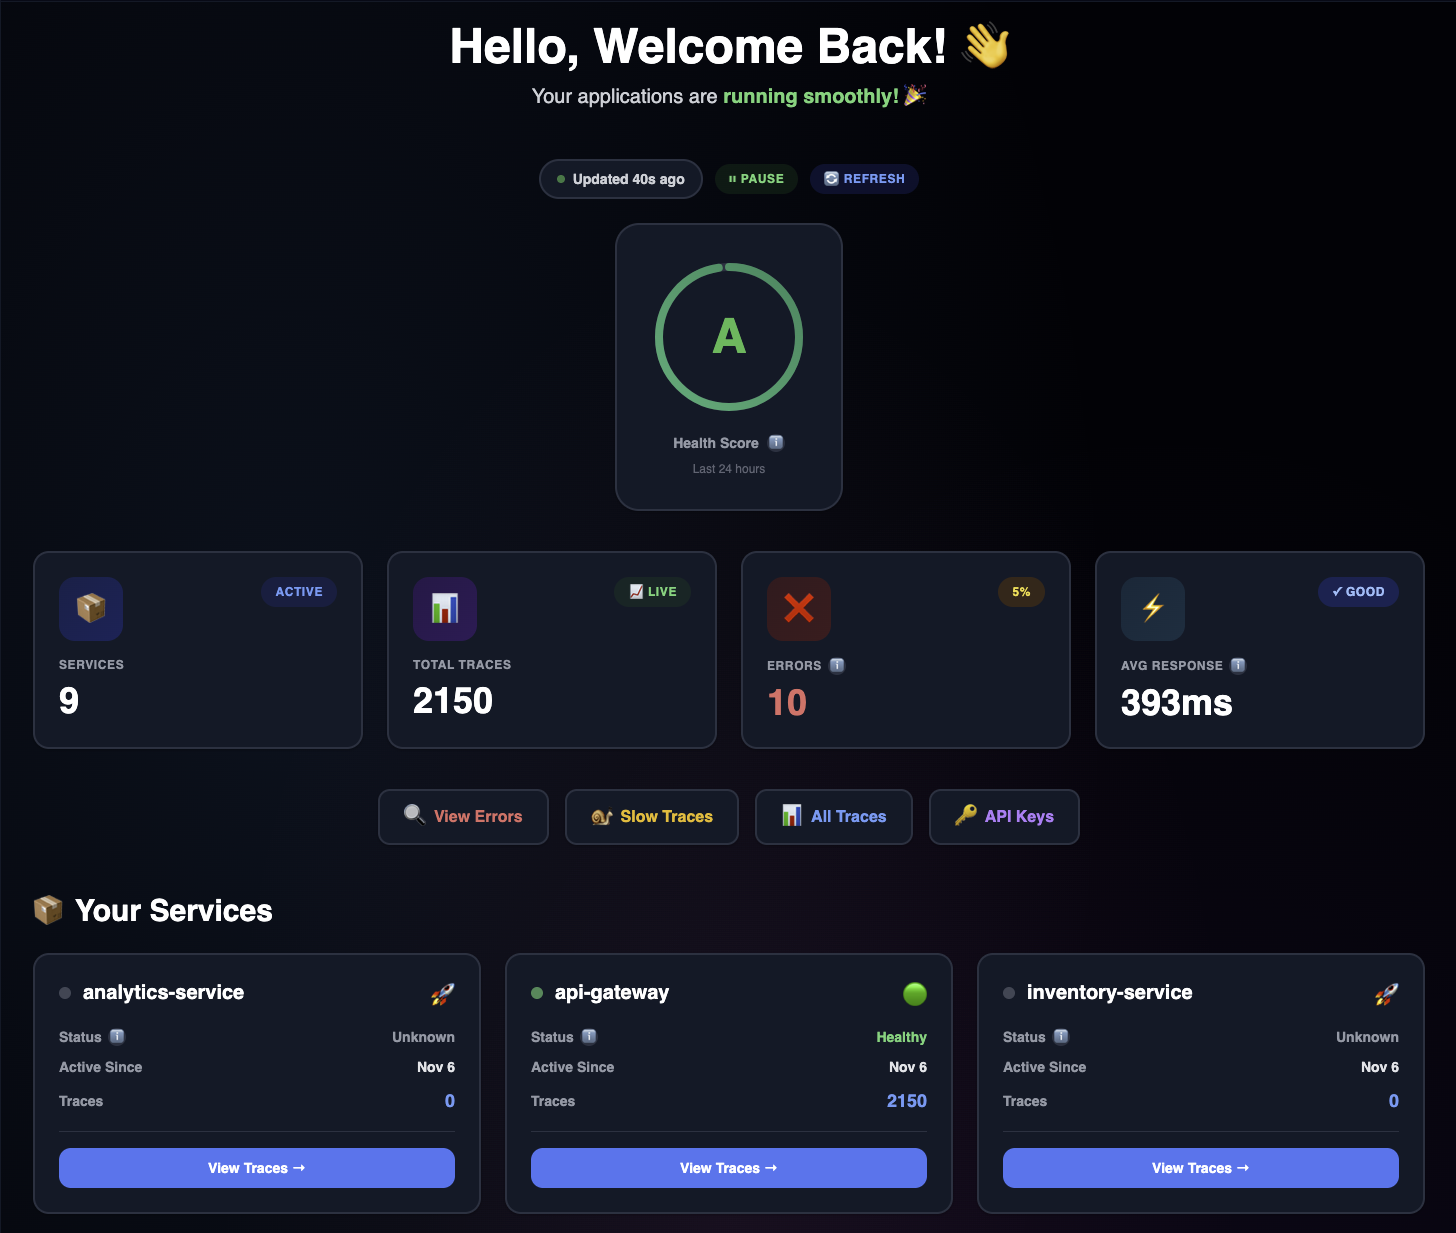
AI-Powered Performance Anomaly Detection
Know About Problems Before Users Complain
TraceKit automatically detects when your services are performing slower than normal using statistical baseline analysis. Get alerted via email and see anomalies highlighted directly on traces.
- Automatic baseline calculation from last 7 days of traces (p50, p95, p99)
- Smart severity classification: Warning (3x slower) or Critical (6x+ slower)
- Real-time email alerts with baseline vs actual performance metrics
- In-trace alert banners show performance issues in context
- Centralized dashboard with anomaly count, filtering, and acknowledgment tracking
- Configurable sensitivity and rate limiting to prevent alert fatigue

Datadog Quality Without Datadog Anxiety
| Feature | TraceKit | Datadog | Sentry |
|---|---|---|---|
| Distributed Tracing | ✅ Full APM | ✅ Full APM | ❌ Errors only |
| Setup Time | ✅ 5 minutes | ⚠️ Hours/days | ✅ 10 minutes |
| Pricing Model | ✅ Predictable | ❌ Unpredictable | ✅ Predictable |
| Starting Price | ✅ $29/mo | ⚠️ ~$15/host/mo* | ✅ $26/mo |
| Custom Metrics | ✅ Included | ❌ $0.05 each | N/A |
| Trace Context | ✅ Automatic | ✅ Automatic | ❌ Manual |
| Learning Curve | ✅ Low | ⚠️ High | ✅ Low |
| Team Members | ✅ Unlimited | ❌ $5-25/user | ❌ Limited by plan |
*Datadog infrastructure costs often exceed $200+/month for small teams
Transparent Pricing. No Surprises.
All plans include unlimited services, unlimited metrics, and unlimited team members.
Only traces are metered.
Starter
Perfect for early-stage teams
- ✓ 1M traces/month
- ✓ 30-day retention
- ✓ Unlimited team members
- ✓ Unlimited services
- ✓ Unlimited metrics
- ✓ Email support
- ✓ All features included
Best for: Side projects, MVPs (~100K requests/day)
Growth
For growing products
- ✓ 10M traces/month
- ✓ 30-day retention
- ✓ Unlimited team members
- ✓ Unlimited services
- ✓ Unlimited metrics
- ✓ Priority support
- ✓ All features included
Best for: Growing startups (~1M requests/day)
Pro
For high-traffic apps
- ✓ 50M traces/month
- ✓ 180-day retention
- ✓ Unlimited team members
- ✓ Unlimited services
- ✓ Unlimited metrics
- ✓ Dedicated support
- ✓ SLA included
Best for: Established products (~5M requests/day)
Built for Teams Who Ship Fast
Real scenarios. Real solutions. Real time savings.
User-Specific Bugs
"Why does this only fail for some users?"
See the exact user session, request data, and code path that triggered the error. No reproduction needed. Click the trace → See their complete journey → Fix it.
Performance Bottlenecks
"Which microservice is slowing everything down?"
Flame graphs instantly reveal the bottleneck—that slow database query buried 3 services deep. View trace → See flame graph → Identify slow query → Optimize it.
Production Incidents
"Production is down. What changed?"
See the deployment timeline, which service failed first, and the cascade of errors across your system. Check dashboard → See service map → Identify failing service → Roll back.
Feature Impact Analysis
"Is our new feature causing issues?"
Track feature flag performance, error rates by feature, and user impact in real-time. Filter by feature flag → Compare metrics → Identify issues → Disable flag if needed.
Onboarding New Developers
"How does our architecture actually work?"
Auto-generated service dependency maps show the actual architecture. Traces show real request flows. New dev explores traces → Understands service interactions → Gets productive faster.
Trusted by Teams Who Value Their Time
"We were spending hours correlating logs across 8 microservices. TraceKit cut our mean time to resolution from 2 hours to 15 minutes."
"Switched from Datadog when our bill hit $800/month. TraceKit gives us the same insights for $99. Honestly can't believe we waited so long."
"Setup took literally 5 minutes. First production issue we debugged saved us 3 hours. Paid for itself in the first week."
Frequently Asked Questions
TraceKit focuses exclusively on distributed tracing and APM—the features teams actually use daily. We skip the enterprise complexity (security monitoring, network monitoring, complex RBAC) that small teams don't need.
Result: 1/10th the price, 10x faster setup.
Think of it as "Datadog APM for small teams."
For Laravel, Express, NestJS, and other popular frameworks—no. TraceKit auto-instruments these frameworks with 3 lines of setup.
Supported languages & frameworks:
- PHP: Laravel, Symfony
- Node.js/TypeScript: Express, NestJS, Fastify
- Go: Gin, Echo, net/http
- Python: FastAPI, Flask, Django
- Java: Spring Boot
- Ruby: Rails, Sinatra
Our pricing is based on monthly trace volume, not real-time usage.
If you're on the $99 plan (10M traces/month) and hit 12M one month, we'll reach out to help you upgrade. No surprise bills.
We never:
- Cut you off mid-month
- Charge overage fees without warning
- Bill you for traffic spikes retroactively
Your bill is predictable.
Typical timeline:
- Create account: 2 minutes
- Generate API key: 30 seconds
- Add instrumentation code: 2-3 minutes
- Deploy and see first trace: 2 minutes
Total: ~5-10 minutes for first service
Adding more services: ~2 minutes each
Yes. We take security seriously:
- Encryption at rest (AES-256)
- Encryption in transit (TLS 1.3)
- SOC 2 Type II certified (in progress)
- GDPR compliant
- Regular penetration testing
- No data sharing with third parties
Yes! 7-day free trial via Stripe.
Trial includes:
- Full access to all features
- Selected plan limits
- Unlimited team members
- Email support
Select your plan at signup. $0 charged for 7 days.
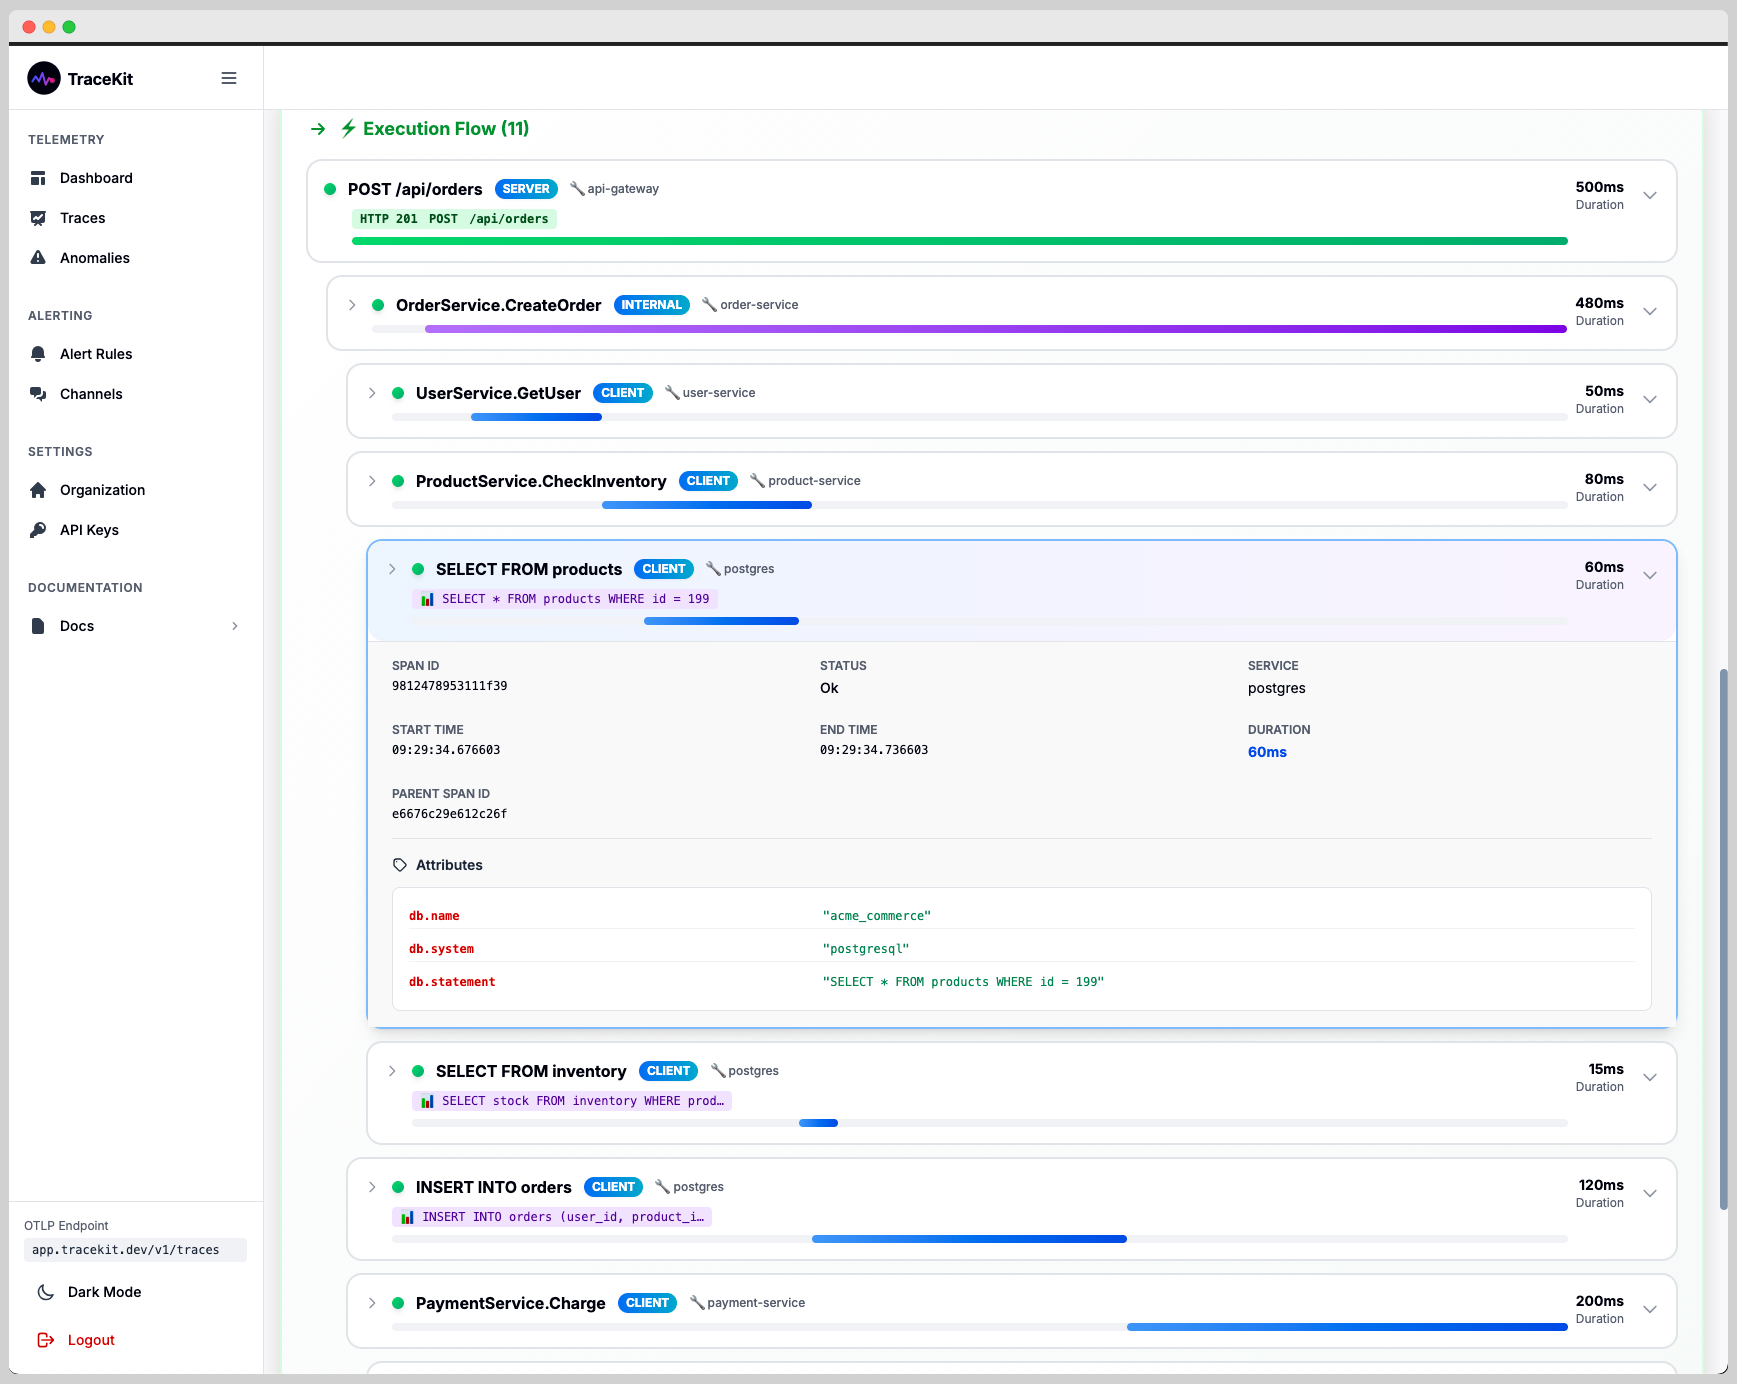
A trace is one request through your system, including all its spans.
Example: API request that:
- Queries the database (1 span)
- Calls external service (1 span)
- Returns response (1 span)
= 1 trace (3 spans)
You're charged per trace, not per span. Unlimited spans per trace.
TraceKit automatically learns your services' normal performance and alerts you when things slow down.
How it works:
- Analyzes last 7 days of traces to establish baseline (p50, p95, p99)
- Detects when new traces are significantly slower (3x+ for Warning, 6x+ for Critical)
- Sends email alerts with performance metrics and direct trace links
- Shows alert banners directly on slow traces for immediate context
- Provides centralized dashboard to view all anomalies, filter by severity, and track acknowledgments
Result: Know about problems before users complain. See issues in context. No manual threshold configuration needed.
All plans include email support.
Response times:
- Starter: <24 hours
- Growth: <12 hours
- Pro: <4 hours
- Enterprise: <1 hour + dedicated Slack channel
Plus: Community Discord, video tutorials, and comprehensive docs for all plans.
Still have questions?
Email Us
Stop Guessing.
Start Knowing.
Join teams who debug production issues in seconds, not days.
7-day free trial. $0 charged until trial ends.